CarMax 2004 Annual Report Download - page 26
Download and view the complete annual report
Please find page 26 of the 2004 CarMax annual report below. You can navigate through the pages in the report by either clicking on the pages listed below, or by using the keyword search tool below to find specific information within the annual report.-
 1
1 -
2
-
3
-
4
-
5
-
6
-
7
-
8
-
9
-
10
-
11
-
12
-
13
-
14
-
15
-
 16
16 -
 17
17 -
 18
18 -
 19
19 -
 20
20 -
 21
21 -
 22
22 -
 23
23 -
 24
24 -
 25
25 -
 26
26 -
 27
27 -
 28
28 -
 29
29 -
 30
30 -
 31
31 -
 32
32 -
 33
33 -
 34
34 -
 35
35 -
 36
36 -
37
-
38
-
39
-
40
-
41
-
42
-
43
-
44
-
45
-
46
-
47
-
48
-
49
-
50
-
51
-
52
 |
 |

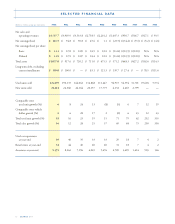
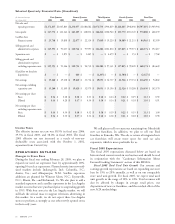
Selected Quarterly Financial Data (Unaudited)
(In thousands except
First Quarter Second Quarter Third Quarter Fourth Quarter Fiscal Year
per share data)
2004 2003 2004 2003 2004 2003 2004 2003 2004 2003
Net sales and
operating revenues $1,172,835 $1,005,803 $1,236,457 $1,080,682 $1,071,534 $936,819 $1,116,865 $946,640 $4,597,691 $3,969,944
Gross profit $147,771 $122,142 $163,105 $128,812 $126,242 $106,940 $133,770 $110,345 $570,888 $468,239
CarMax Auto
Finance income $25,748 $19,838 $22,677 $22,110 $17,649 $19,220 $18,889 $21,231 $84,963 $82,399
Selling, general, and
administrative expenses $115,553 $93,037 $120,714 $97,997 $114,282 $101,810 $117,825 $99,573 $468,374 $392,417
Separation costs $ — $1,871 $—$1,265 $—$4,479 $—$153 $—$7,768
Selling, general, and
administrative expenses
excluding separation costs $115,553 $91,166 $120,714 $96,732 $114,282 $97,331 $117,825 $99,420 $468,374 $384,649
(Gain)/loss on franchise
dispositions $—$—$460 $—$(1,207) $—$(1,580) $—$(2,327) $—
Net earnings $35,260 $29,238 $39,610 $31,714 $19,053 $14,717 $22,526 $19,133 $116,450 $94,802
Net earnings excluding
separation costs $35,260 $31,109 $39,610 $32,979 $19,053 $19,196 $22,526 $19,286 $116,450 $102,570
Net earnings per share:
Basic $0.34 $0.28 $0.38 $0.31 $0.18 $0.14 $0.22 $0.19 $1.13 $0.92
Diluted $0.34 $0.28 $0.37 $0.30 $0.18 $0.14 $0.21 $0.18 $1.10 $0.91
Net earnings per share
excluding separation costs:
Basic $0.34 $0.30 $0.38 $0.32 $0.18 $0.19 $0.22 $0.19 $1.13 $1.00
Diluted $0.34 $0.30 $0.37 $0.32 $0.18 $0.18 $0.21 $0.18 $1.10 $0.98
24
CARMAX
2004
Income Taxes
The effective income tax rate was 38.5% in fiscal year 2004,
39.5% in fiscal 2003, and 38.0% in fiscal 2002. The fiscal
2003 effective tax rate increased as a result of non-tax-
deductible costs associated with the October 1, 2002,
separation from Circuit City.
OPERATIONS OUTLOOK
Changes in Store Base
During the fiscal year ending February 28, 2005, we plan to
expand our used car superstore base by approximately 20%,
opening 10 used car superstores. Planned entries into new mid-
sized markets include Indianapolis, Ind.; Columbia, S.C.;
Austin, Tex.; and Albuquerque, N.M. Satellite superstore
additions are planned for Winston Salem, N.C.; Fayetteville,
N.C.; Miami, Fla.; and Richmond, Va. We also plan to add a
standard superstore and a satellite superstore in the Los Angeles
market on sites that were purchased prior to suspending growth
in 1999. With four stores in the Los Angeles market, we will
still lack the critical mass to support television advertising in
this market. As a result, we do not expect these Los Angeles
stores to perform as strongly as our other newly opened stores
in their early years.
We still plan to sell or return our remaining four Mitsubishi
new car franchises. In addition, we plan to sell our Ford
franchise in Kenosha, Wis. The sale or return of integrated new
car franchises will create more space for used car sales
expansion, which is more profitable for us.
Fiscal 2005 Expectations
The fiscal 2005 expectations discussed below are based on
historical and current trends in our business and should be read
in conjunction with the “Cautionary Information About
Forward-Looking Statements” section of this MD&A.
Fiscal 2005 Total Used Unit Growth. Our revenue and
earnings growth expectations are based on expanding our store
base by 15% to 20% annually, as well as on our comparable
store used unit growth. For fiscal 2005, we expect total used
unit growth in the range of 18% to 22%. Total revenues will
also be affected by changes in average retail prices, our
dispositions of new car franchises, and the residual effect of the
new ACR methodology.