CarMax 2004 Annual Report Download - page 25
Download and view the complete annual report
Please find page 25 of the 2004 CarMax annual report below. You can navigate through the pages in the report by either clicking on the pages listed below, or by using the keyword search tool below to find specific information within the annual report.-
 1
1 -
2
-
3
-
4
-
5
-
6
-
7
-
8
-
9
-
10
-
11
-
12
-
13
-
14
-
 15
15 -
 16
16 -
 17
17 -
 18
18 -
 19
19 -
 20
20 -
 21
21 -
 22
22 -
 23
23 -
 24
24 -
 25
25 -
 26
26 -
 27
27 -
 28
28 -
 29
29 -
 30
30 -
 31
31 -
 32
32 -
 33
33 -
 34
34 -
 35
35 -
36
-
37
-
38
-
39
-
40
-
41
-
42
-
43
-
44
-
45
-
46
-
47
-
48
-
49
-
50
-
51
-
52
 |
 |
CARMAX
2004 23
CAF originates automobile loans to CarMax customers at
competitive market rates of interest. The majority of the profit
contribution from CAF is generated by the spread between the
interest rate charged to the customer and the cost of funds.
Substantially all of the loans originated by CAF each month are
sold in securitization transactions as described in Note 4 to the
company’s consolidated financial statements. A gain, recorded
at the time of the securitization transaction, results from
recording a receivable equal to the present value of the expected
residual cash flows generated by the securitized receivables. The
cash flows are calculated taking into account expected
prepayment and default rates.
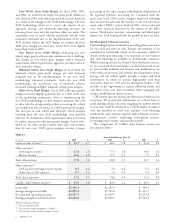
CarMax Auto Finance income as a percentage of total net
sales and operating revenues decreased in fiscal 2004. The
decrease was attributable to spreads returning to more
normalized levels during the second half of fiscal 2004. During
fiscal 2002, fiscal 2003, and the first half of fiscal 2004, we
benefited from higher than normal spreads due to consumer
loan rates falling more slowly than our cost of funds. The fiscal
2003 increase in CAF income as a percentage of net sales and
operating revenues was primarily the result of the $11.8 million
increase in the gains on sales of loans and the increase in other
income related to our managed portfolio. The gains on sales of
loans increase resulted from an increase in loans sold driven by
a higher sales volume and higher CAF penetration, partially
offset by a marginal decline in yield spreads. The increase in
other income and total direct expenses was proportionate to the
increase in the managed receivables for all fiscal years presented.
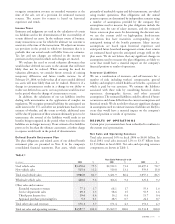
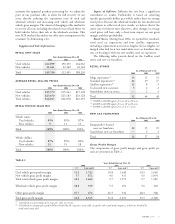
We are at risk for the performance of the securitized
receivables managed to the extent that we maintain a retained
interest in the receivables. Supplemental information on our
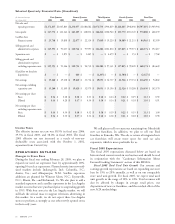
portfolio of managed receivables is shown in the following tables:
As of February 29 or 28
(In millions)
2004 2003 2002
Loans securitized $2,200.4 $1,859.1 $1,489.4
Loans held for sale
or investment 48.2 19.6 13.9
Ending managed receivables $2,248.6 $1,878.7 $1,503.3
Accounts 31+ days past due $31.4 $ 27.6 $ 22.3
Past due accounts as a
percentage of ending
managed receivables 1.40% 1.47% 1.48%
Years Ended February 29 or 28
(In millions)
2004 2003 2002
Average managed
receivables $2,099.4 $1,701.0 $1,393.7
Credit losses on managed
receivables $21.1 $ 17.5 $ 12.9
Credit losses as a
percentage of average
managed receivables 1.01% 1.03% 0.93%
Credit losses as a percentage of average managed receivables
for fiscal years 2004 and 2003 were comparable. The increase
in losses as a percentage of average managed receivables for
fiscal 2003 compared with fiscal 2002 was primarily due to
depressed wholesale vehicle values which led to lower recovery
rates on repossessed vehicles. The recovery rate was 42% in
fiscal 2004, 43% in fiscal 2003, and 45% in fiscal 2002. The
recovery rate represents the average percentage of the
outstanding principal balance CarMax receives when a vehicle
is repossessed and liquidated.
If the managed receivables do not perform in accordance
with the assumptions used in determining the fair value of the
retained interests, earnings could be impacted. Past due
accounts as a percentage of ending managed receivables were
comparable for all fiscal years presented. In fiscal 2004, we
adjusted the cumulative default rate assumptions for certain
pools of receivables. We increased the loss rates for two of our
older pools of receivables to reflect slightly higher losses at the
end of the pools’ lives. We also increased the loss rate on current
originations from 1.85% to 2.00%, reflecting current
economic conditions, including weak recovery rates that
stabilized at historically low levels. There was no change in the
credit quality of the receivables, which was at the high end of
our historical range. The changes resulted in no material impact
on earnings or the fair value of retained interests. Details
concerning the assumptions used to value the retained interests
and the sensitivity to adverse changes in the performance of the
managed receivables are included in Note 4 to the company’s
consolidated financial statements.
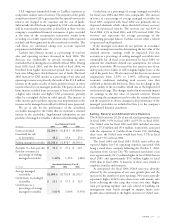
Selling, General and Administrative Expenses
The SG&A ratio was 10.2% of net sales and operating revenues
in fiscal 2004, 9.9% in fiscal 2003, and 9.5% in fiscal 2002.
The SG&A ratio for fiscal 2003 and 2002 included one-time
costs of $7.8 million and $0.4 million, respectively, associated
with the separation of CarMax from Circuit City. Excluding
these costs, the SG&A ratio would have been 9.7% in fiscal
2003 and 9.5% in fiscal 2002.
The fiscal 2004 and fiscal 2003 SG&A ratios reflect the
expected higher level of operating expenses associated with
being a stand-alone company following the October 1, 2002,
separation from Circuit City. We estimated stand-alone costs
were approximately $13.5 million higher in fiscal 2004 than in
fiscal 2003, and approximately $9.0 million higher in fiscal
2003 than in fiscal 2002. A majority of these costs related to
employee benefits and insurance.
As anticipated, the fiscal 2004 SG&A ratio was adversely
affected by the resumption of our store growth plan and the
increase in the number of store openings. New stores typically
experience higher SG&A ratios than stores with mature sales
levels, reflecting the sales ramp that occurs over time. Higher
total pre-opening expenses and costs related to building our
management team bench strength to support future store
growth also contributed to the higher current year SG&A ratio.