CarMax 2004 Annual Report Download - page 24
Download and view the complete annual report
Please find page 24 of the 2004 CarMax annual report below. You can navigate through the pages in the report by either clicking on the pages listed below, or by using the keyword search tool below to find specific information within the annual report.-
 1
1 -
2
-
3
-
4
-
5
-
6
-
7
-
8
-
9
-
10
-
11
-
12
-
13
-
 14
14 -
 15
15 -
 16
16 -
 17
17 -
 18
18 -
 19
19 -
 20
20 -
 21
21 -
 22
22 -
 23
23 -
 24
24 -
 25
25 -
 26
26 -
 27
27 -
 28
28 -
 29
29 -
 30
30 -
 31
31 -
 32
32 -
 33
33 -
 34
34 -
35
-
36
-
37
-
38
-
39
-
40
-
41
-
42
-
43
-
44
-
45
-
46
-
47
-
48
-
49
-
50
-
51
-
52
 |
 |
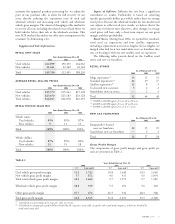
Used Vehicle Gross Profit Margin. In fiscal 2004, 2003,
and 2002, we achieved our targets for gross profit dollars per
unit. In fiscal 2004, used vehicle gross profit per unit increased
as a result of the change in the ACR methodology. The new
ACR methodology allows us to recover the expense of our
appraisal, buying, and wholesale operating processes by
factoring those costs into the purchase offers we make. The
acquisition cost of used vehicles purchased directly from
consumers decreased due to the implementation of the new
ACR method. Absent the ACR change, we estimate the fiscal
2004 gross margin per used unit would have been slightly
lower than in fiscal 2003.
New Vehicle Gross Profit Margin. Achieving our new
vehicle target gross profit per unit continues to be a challenge.
The decline in new vehicle gross margins reflects increased
competition, which required more aggressive pricing in order to
drive unit sales volume.
Wholesale Vehicle Gross Profit Margin. In fiscal 2004, the
wholesale vehicle gross profit margin per unit increased
primarily due to the implementation of our new ACR
methodology discussed previously. Under the new ACR
methodology, the acquisition cost of wholesale vehicles
decreased resulting in higher wholesale vehicle gross margins.
Other Gross Profit Margin. Fiscal 2004 other gross profit
margin increased slightly, primarily due to a shift in the mix
of the underlying components. Prior to implementing the
new ACR methodology, we had charged customers who sold
us their vehicles an appraisal purchase processing fee, which
was included in other revenues at a 100% gross profit margin.
The increases in used vehicle and wholesale vehicle margins
resulting from the new ACR methodology were partially
offset by the elimination of the appraisal purchase processing
fee and its impact on other gross profit margin. Service sales,
which are the only category within other sales and revenues
that do not carry 100% gross margins, became a larger
percentage of the other category following the elimination of
the appraisal purchase processing fee. Compared with the
prior year, fiscal 2004 service margins improved reflecting
increased service sales and the benefits of our new electronic
repair order (“ERO”) system. In fiscal 2003, service sales and
costs were adversely impacted by the rollout of the ERO
system. Third-party warranty commissions and third-party
finance fees both benefited from the growth in used car sales.
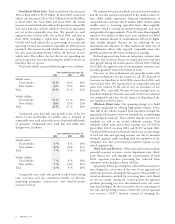
CarMax Auto Finance Income
CAF’s lending business is limited to providing prime auto loans
for our used and new car sales. Because the purchase of an
automobile is traditionally reliant on the consumer’s ability to
obtain on-the-spot financing, it is important to our business
that such financing be available to creditworthy customers.
While financing can also be obtained from third-party sources,
we are concerned that total reliance on third parties can create
an unacceptable volatility and business risk. Furthermore, we
believe that our processes and systems, the transparency of our
pricing, and our vehicle quality provide a unique and ideal
environment in which to procure high-quality auto loan
receivables, both for CAF and for third-party lenders. CAF
provides us the opportunity to capture additional profits and
cash flows from auto loan receivables while managing our
reliance on third-party finance sources.
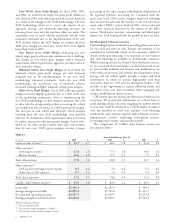
CAF income does not include any allocation of indirect costs
or income. We present this information on a direct basis to
avoid making arbitrary decisions regarding the indirect benefit
or costs that could be attributed to CAF. Examples of indirect
costs not included are retail store expenses, retail financing
commissions, and corporate expenses such as human resources,
administrative services, marketing, information systems,
accounting, legal, treasury, and executive payroll.
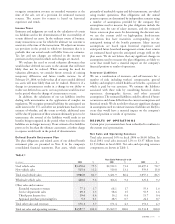
The components of CarMax Auto Finance income are
presented in Table 3.
22
CARMAX
2004
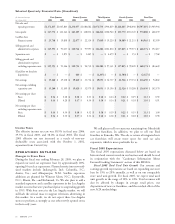
TABLE 3
Years Ended February 29 or 28
(In millions)
2004 % 2003 % 2002 %
Gains on sales of loans(1) $65.1 4.7 $ 68.2 5.8 $ 56.4 6.0
Other income(2):
Servicing fee income 21.8 1.0 17.3 1.0 14.0 1.0
Interest income 16.0 0.8 11.5 0.7 7.7 0.6
Total other income 37.8 1.8 28.8 1.7 21.7 1.6
Direct expenses(2):
CAF payroll and fringe benefit expense 8.2 0.4 7.0 0.4 5.7 0.4
Other direct CAF expenses 9.7 0.5 7.6 0.4 5.9 0.4
Total direct expenses 17.9 0.9 14.6 0.9 11.6 0.8
CarMax Auto Finance income(3) $85.0 1.8 $ 82.4 2.1 $ 66.5 1.9
Loans sold $1,390.2 $1,185.9 $ 938.5
Average managed receivables $2,099.4 $1,701.0 $1,393.7
Net sales and operating revenues $4,597.7 $3,969.9 $3,533.8
Ending managed receivables balance $2,248.6 $1,878.7 $1,503.3
Percent columns indicate:
(1) Percent of loans sold.
(2) Percent of average managed receivables.
(3) Percent of net sales and operating revenues.