CarMax 1999 Annual Report Download - page 80
Download and view the complete annual report
Please find page 80 of the 1999 CarMax annual report below. You can navigate through the pages in the report by either clicking on the pages listed below, or by using the keyword search tool below to find specific information within the annual report.-
 1
1 -
2
-
3
-
4
-
5
-
6
-
7
-
8
-
9
-
10
-
11
-
12
-
13
-
14
-
15
-
16
-
17
-
18
-
19
-
20
-
21
-
22
-
23
-
24
-
25
-
26
-
27
-
28
-
29
-
30
-
31
-
32
-
33
-
34
-
35
-
36
-
37
-
38
-
39
-
40
-
41
-
42
-
43
-
44
-
45
-
46
-
47
-
48
-
49
-
50
-
51
-
52
-
53
-
54
-
55
-
56
-
57
-
58
-
59
-
60
-
61
-
62
-
63
-
64
-
65
-
66
-
67
-
68
-
69
-
 70
70 -
 71
71 -
 72
72 -
 73
73 -
 74
74 -
 75
75 -
 76
76 -
 77
77 -
 78
78 -
 79
79 -
 80
80 -
 81
81 -
 82
82 -
 83
83 -
 84
84 -
 85
85 -
 86
86
 |
 |

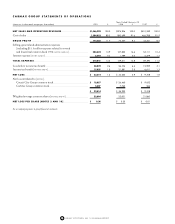
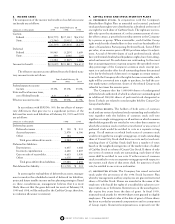
10. NET LOSS PER SHARE
The calculation of net loss per share is presented below:
(Amounts in thousands
Years Ended February 28
except per share data)
1999 1998 1997
Weighted average common
shares..................................... 22,604 22,001 21,860
Loss available to common
shareholders .......................... $ 5,457 $ 7,763 $ 266
Net loss per share........................ $ 0.24 $ 0.35 $ 0.01
The CarMax Group had no diluted net loss per share because
the Group had net losses for the periods presented.
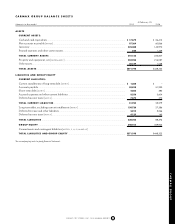
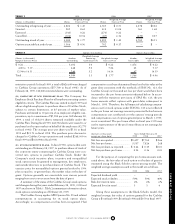
11. PENSION PLAN
The Company has a noncontributory defined benefit pension plan
covering the majority of full-time employees who are at least age
21 and have completed one year of service. The cost of the pro-
gram is being funded currently. Plan benefits generally are based
on years of service and average compensation. Plan assets consist
primarily of equity securities and included 80,000 shares of
Circuit City Stock at February 28, 1999 and 1998.
Eligible employees of the CarMax Group participate in the
Company’s plan. Pension costs for these employees have been
allocated to the CarMax Group based on its proportionate share
of the projected benefit obligation. The following tables set forth
the CarMax Group’s share of the Plan’s financial status and
amounts recognized in the balance sheets as of February 28:
(Amounts in thousands)
1999 1998
Change in benefit obligation:
Benefit obligation at beginning of year............. $ 958 $ 521
Service cost ...................................................... 525 219
Interest cost...................................................... 67 39
Actuarial loss .................................................... 1,015 179
Benefit obligation at end of year....................... $ 2,565 $ 958
Change in plan assets:
Fair value of plan assets at beginning of year .... $ 1,242 $ 895
Actual return on plan assets.............................. 69 185
Employer contributions.................................... 242 162
Fair value of plan assets at end of year............... $ 1,553 $1,242
Reconciliation of funded status:
Funded status.................................................... $(1,012) $ 284
Unrecognized actuarial loss (gain)................... 1,063 (2)
Unrecognized transition asset.......................... (8) (11)
Unrecognized prior service benefit.................. (8) (9)
Net amount recognized.................................... $ 35 $ 262
The components of net pension expense are as follows:
Years Ended February 28
(Amounts in thousands)
1999 1998 1997
Service cost................................................ $ 525 $219 $162
Interest cost................................................ 67 39 34
Expected return on plan assets ................... (119) (73) (55)
Amortization of prior service cost.............. (1) (1) (1)
Amortization of transitional asset .............. (3) (3) (3)
Recognized actuarial loss ........................... – 17 17
Net pension expense.................................. $ 469 $198 $154
Assumptions used in the accounting for the pension plan were:
Years Ended February 28
1999 1998 1997
Weighted average discount rate................. 6.8% 7.0% 7.5%
Rate of increase in compensation levels..... 5.0% 5.0% 5.5%
Expected rate of return on plan assets ........ 9.0% 9.0% 9.0%
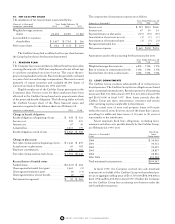
12. LEASE COMMITMENTS
The CarMax Group conducts substantially all of its business in
leased premises. The CarMax Group’s lease obligations are based
upon contractual minimum rates. Rental expenses for all operating
leases were $23,521,000 in fiscal 1999, $11,421,000 in fiscal 1998
and $6,019,000 in fiscal 1997. Most leases provide that the
CarMax Group pay taxes, maintenance, insurance and certain
other operating expenses applicable to the premises.
The initial term of most real property leases will expire
within the next 22 years; however, most of the leases have options
providing for additional lease terms of 10 years to 20 years at
terms similar to the initial terms.
Future minimum fixed lease obligations, excluding taxes,
insurance and other costs payable directly by the CarMax Group,
as of February 28, 1999, were:
Operating
(Amounts in thousands)
Lease
Fiscal Commitments
2000 ............................................................................. $ 30,965
2001 ............................................................................. 30,312
2002 ............................................................................. 29,059
2003 ............................................................................. 28,837
2004 ............................................................................. 28,836
After 2004 .................................................................... 451,538
Total minimum lease payments..................................... $599,547
In fiscal 1999, the Company entered into sale-leaseback
transactions on behalf of the CarMax Group with unrelated par-
ties at an aggregate selling price of $131,750,000 ($98,098,000 in
fiscal 1998 and $16,450,000 in fiscal 1997). Neither the Company
nor the CarMax Group has continuing involvement under the
sale-leaseback transactions.
78 CIRCUIT CITY STORES, INC. 1999 ANNUAL REPORT