CarMax 1999 Annual Report Download - page 61
Download and view the complete annual report
Please find page 61 of the 1999 CarMax annual report below. You can navigate through the pages in the report by either clicking on the pages listed below, or by using the keyword search tool below to find specific information within the annual report.-
 1
1 -
2
-
3
-
4
-
5
-
6
-
7
-
8
-
9
-
10
-
11
-
12
-
13
-
14
-
15
-
16
-
17
-
18
-
19
-
20
-
21
-
22
-
23
-
24
-
25
-
26
-
27
-
28
-
29
-
30
-
31
-
32
-
33
-
34
-
35
-
36
-
37
-
38
-
39
-
40
-
41
-
42
-
43
-
44
-
45
-
46
-
47
-
48
-
49
-
50
-
 51
51 -
 52
52 -
 53
53 -
 54
54 -
 55
55 -
 56
56 -
 57
57 -
 58
58 -
 59
59 -
 60
60 -
 61
61 -
 62
62 -
 63
63 -
 64
64 -
 65
65 -
 66
66 -
 67
67 -
 68
68 -
 69
69 -
 70
70 -
 71
71 -
72
-
73
-
74
-
75
-
76
-
77
-
78
-
79
-
80
-
81
-
82
-
83
-
84
-
85
-
86
 |
 |

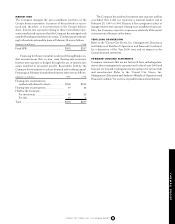
1988 Plan for employees, it is at least 85 percent of the market
value at the date of grant (100 percent under the 1994 Plan).
Options generally are exercisable over a period of from one to 10
years from the date of grant.
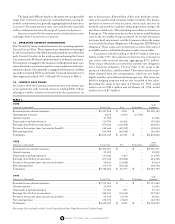
A summary of the status of the Circuit City Group’s stock
options and changes during the years ended February 28, 1999,
1998 and 1997 are shown in Table 1. Table 2 summarizes informa-
tion about stock options outstanding as of February 28, 1999.
The Circuit City Group applies APB Opinion No. 25 and
related interpretations in accounting for its stock option plans.
Accordingly, no compensation cost has been recognized. Had
compensation cost been determined based on the fair value at the
grant date consistent with the methods of SFAS No. 123, the
Circuit City Group’s net earnings and net earnings per share
would have been reduced to the pro forma amounts indicated in
the next column. In accordance with the transition provisions of
SFAS No. 123, the pro forma amounts reflect options with grant
dates subsequent to March 1, 1995. Therefore, the full impact of
calculating compensation cost for stock options under SFAS No.
123 is not reflected in the pro forma net earnings amounts pre-
sented because compensation cost is reflected over the options’
vesting periods and compensation cost of options granted prior to
March 1, 1995, is not considered. The pro forma effect on fiscal
year 1999 may not be representative of the pro forma effects on
net earnings for future years.
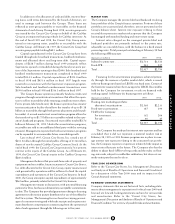
(Amounts in thousands
Years Ended February 28
except per share data)
1999 1998 1997
Net earnings-as reported ........ $148,381 $112,074 $136,680
Net earnings-pro forma .......... 142,479 107,399 133,326
Basic net earnings per
share-as reported ............... $ 1.50 $ 1.14 $ 1.40
Basic net earnings per
share-pro forma ................. 1.44 1.10 1.37
Diluted net earnings per
share-as reported ............... $ 1.48 $ 1.13 $ 1.39
Diluted net earnings per
share-pro forma ................. 1.42 1.08 1.35
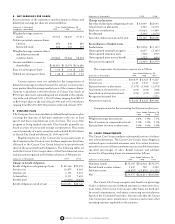
For the purpose of computing the pro forma amounts indi-
cated above, the fair value of each option on the date of grant is
estimated using the Black-Scholes option-pricing model. The
weighted average assumptions used in the model are as follows:
1999 1998 1997
Expected dividend yield................... 0.4% 0.4% 0.4%
Expected stock volatility.................. 33% 33% 33%
Risk-free interest rates...................... 6% 6% 6%
Expected lives (in years)................... 5 4 4
Using these assumptions in the Black-Scholes model, the
weighted average fair value of options granted for the Circuit City
Group is $15 in fiscal 1999, $13 in fiscal 1998 and $8 in fiscal 1997.
CIRCUIT CITY GROUP
CIRCUIT CITY STORES, INC. 1999 ANNUAL REPORT 59
TABLE 1 1999 1998 1997
Weighted Average Weighted Average Weighted Average
(Shares in thousands)
Shares Exercise Price Shares Exercise Price Shares Exercise Price
Outstanding at beginning of year............... 4,994 $32.00 4,828 $29.76 3,563 $18.63
Granted...................................................... 540 42.33 726 35.21 2,159 43.38
Exercised.................................................... (1,004) 17.53 (483) 15.00 (786) 17.67
Cancelled................................................... (83) 33.59 (77) 29.42 (108) 21.90
Outstanding at end of year......................... 4,447 $36.49 4,994 $32.00 4,828 $29.76
Options exercisable at end of year ............. 1,483 $24.03 1,754 $19.68 1,629 $17.24
TABLE 2 Options Outstanding Options Exercisable
Weighted Average
(Shares in thousands)
Number Remaining Weighted Average Number Weighted Average
Range of Exercise Prices Outstanding Contractual Life Exercise Price Exercisable Exercise Price
$15.69 to 20.13................................................... 474 2.0 $18.34 474 $18.34
22.50 to 29.13................................................... 701 2.1 23.49 617 23.63
29.50 to 38.00................................................... 1,748 5.2 31.97 392 31.55
38.38 to 48.56................................................... 524 7.1 42.40 – –
59.00................................................................. 1,000 3.1 59.00 – –
Total.................................................................... 4,447 4.1 $36.49 1,483 $24.03