CarMax 1999 Annual Report Download - page 32
Download and view the complete annual report
Please find page 32 of the 1999 CarMax annual report below. You can navigate through the pages in the report by either clicking on the pages listed below, or by using the keyword search tool below to find specific information within the annual report.-
 1
1 -
2
-
3
-
4
-
5
-
6
-
7
-
8
-
9
-
10
-
11
-
12
-
13
-
14
-
15
-
16
-
17
-
18
-
19
-
20
-
21
-
 22
22 -
 23
23 -
 24
24 -
 25
25 -
 26
26 -
 27
27 -
 28
28 -
 29
29 -
 30
30 -
 31
31 -
 32
32 -
 33
33 -
 34
34 -
 35
35 -
 36
36 -
 37
37 -
 38
38 -
 39
39 -
 40
40 -
 41
41 -
 42
42 -
43
-
44
-
45
-
46
-
47
-
48
-
49
-
50
-
51
-
52
-
53
-
54
-
55
-
56
-
57
-
58
-
59
-
60
-
61
-
62
-
63
-
64
-
65
-
66
-
67
-
68
-
69
-
70
-
71
-
72
-
73
-
74
-
75
-
76
-
77
-
78
-
79
-
80
-
81
-
82
-
83
-
84
-
85
-
86
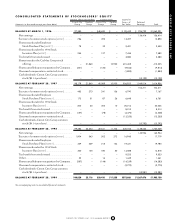
 |
 |

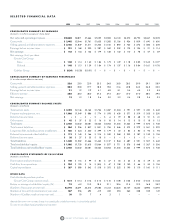
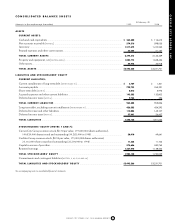
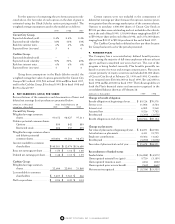
Years Ended February 28
(Amounts in thousands except per share data)
1999 % 1998 % 1997 %
NET SALES AND OPERATING REVENUES ...............................
$10,804,447
100.0 $8,870,797 100.0 $7,663,811 100.0
Cost of sales, buying and warehousing...........................................
8,359,428
77.4 6,827,133 77.0 5,902,711 77.0
GROSS PROFIT ............................................................................
2,445,019
22.6 2,043,664 23.0 1,761,100 23.0
Selling, general and administrative
expenses [NOTE 11] ......................................................................
2,186,177
20.2 1,848,559 20.8 1,511,294 19.7
Interest expense [NOTE 5] .................................................................
28,319
0.3 26,861 0.3 29,782 0.4
TOTAL EXPENSES ........................................................................
2,214,496
20.5 1,875,420 21.1 1,541,076 20.1
Earnings before income taxes .........................................................
230,523
2.1 168,244 1.9 220,024 2.9
Provision for income taxes [NOTE 6].................................................
87,599
0.8 63,933 0.7 83,610 1.1
NET EARNINGS ...........................................................................
$ 142,924
1.3 $ 104,311 1.2 $ 136,414 1.8
Net earnings (loss) attributed to [NOTES 1AND 2]:
Circuit City Group common stock............................................
$ 148,381
$112,074 $ 136,680
CarMax Group common stock..................................................
(5,457)
(7,763) (266)
$142,924
$104,311 $ 136,414
Weighted average common shares [NOTES 2AND 8]:
Circuit City Group:
Basic .....................................................................................
99,152
98,027 97,311
Diluted.................................................................................
100,406
99,204 98,472
CarMax Group..........................................................................
22,604
22,001 21,860
NET EARNINGS (LOSS) PER SHARE [NOTES 2 AND 8]:
Circuit City Group:
Basic .....................................................................................
$ 1.50
$1.14 $ 1.40
Diluted.................................................................................
$1.48
$1.13 $ 1.39
CarMax Group..........................................................................
$ (0.24)
$(0.35) $ (0.01)
See accompanying notes to consolidated financial statements.
CONSOLIDATED STATEMENTS OF EARNINGS
30 CIRCUIT CITY STORES, INC. 1999 ANNUAL REPORT