CarMax 1999 Annual Report Download - page 46
Download and view the complete annual report
Please find page 46 of the 1999 CarMax annual report below. You can navigate through the pages in the report by either clicking on the pages listed below, or by using the keyword search tool below to find specific information within the annual report.-
 1
1 -
2
-
3
-
4
-
5
-
6
-
7
-
8
-
9
-
10
-
11
-
12
-
13
-
14
-
15
-
16
-
17
-
18
-
19
-
20
-
21
-
22
-
23
-
24
-
25
-
26
-
27
-
28
-
29
-
30
-
31
-
32
-
33
-
34
-
35
-
 36
36 -
 37
37 -
 38
38 -
 39
39 -
 40
40 -
 41
41 -
 42
42 -
 43
43 -
 44
44 -
 45
45 -
 46
46 -
 47
47 -
 48
48 -
 49
49 -
 50
50 -
 51
51 -
 52
52 -
 53
53 -
 54
54 -
 55
55 -
 56
56 -
57
-
58
-
59
-
60
-
61
-
62
-
63
-
64
-
65
-
66
-
67
-
68
-
69
-
70
-
71
-
72
-
73
-
74
-
75
-
76
-
77
-
78
-
79
-
80
-
81
-
82
-
83
-
84
-
85
-
86
 |
 |

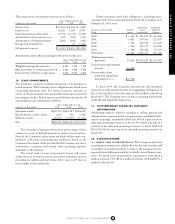
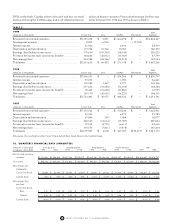
TABLE 3
1999 Total
(Amounts in thousands)
Circuit City Divx CarMax Elimination Segments
Revenues from external customers .......................................... $9,335,298 $ 2,851 $1,466,298 $ – $10,804,447
Intersegment revenues............................................................. 8,872 6,830 – (15,702) –
Interest expense....................................................................... 21,926 – 6,393 – 28,319
Depreciation and amortization ............................................... 119,724 10,566 10,003 – 140,293
Earnings (loss) before income taxes......................................... 379,630 (110,558) (38,549) – 230,523
Provision for income taxes (income tax benefit)...................... 144,646 (42,012) (15,035) – 87,599
Net earnings (loss)................................................................... 234,984 (68,546) (23,514) – 142,924
Total assets .............................................................................. $2,813,635 $ 60,433 $ 571,198 $ – $ 3,445,266
1998 Total
(Amounts in thousands)
Circuit City Divx CarMax Elimination Segments
Revenues from external customers .......................................... $7,996,591 $ – $ 874,206 $ – $ 8,870,797
Interest expense....................................................................... 25,072 – 1,789 – 26,861
Depreciation and amortization ............................................... 110,282 1,467 4,577 – 116,326
Earnings (loss) before income taxes......................................... 257,632 (33,284) (56,104) – 168,244
Provision for income taxes (income tax benefit)...................... 98,462 (12,648) (21,881) – 63,933
Net earnings (loss)................................................................... 159,170 (20,636) (34,223) – 104,311
Total assets .............................................................................. $2,752,402 $ 30,977 $ 448,322 $ – $ 3,231,701
1997 Total
(Amounts in thousands)
Circuit City Divx CarMax Elimination Segments
Revenues from external customers .......................................... $7,153,562 $ – $ 510,249 $ – $ 7,663,811
Interest expense....................................................................... 23,503 – 6,279 – 29,782
Depreciation and amortization ............................................... 97,006 307 1,664 – 98,977
Earnings (loss) before income taxes......................................... 248,567 (12,614) (15,929) – 220,024
Provision for income taxes (income tax benefit)...................... 95,014 (4,793) (6,611) – 83,610
Net earnings (loss)................................................................... 153,553 (7,821) (9,318) – 136,414
Total assets .............................................................................. $2,699,907 $ 4,692 $ 427,187 $(50,613) $ 3,081,173
Net earnings (loss) and total assets for Circuit City exclude the Inter-Group Interest in the CarMax Group.
44 CIRCUIT CITY STORES, INC. 1999 ANNUAL REPORT
DVD at wholesale. CarMax refers to the used- and new-car retail
locations bearing the CarMax name and to all related operations
such as its finance operation. Financial information for these seg-
ments for fiscal 1999, 1998 and 1997 is shown in Table 3.
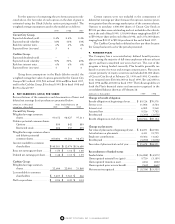
16. QUARTERLY FINANCIAL DATA (UNAUDITED)
(Amounts in thousands
First Quarter Second Quarter Third Quarter Fourth Quarter Year
except per share data)
1999 1998 1999 1998 1999 1998 1999 1998 1999 1998
Net sales and operating
revenues ....................... $2,271,090 $1,856,904 $2,517,154 $2,020,572 $2,612,896 $2,144,219 $3,403,307 $2,849,102 $10,804,447 $8,870,797
Gross profit......................... $ 504,514 $ 418,278 $ 571,672 $ 472,429 $ 592,105 $ 481,753 $ 776,728 $ 671,204 $ 2,445,019 $2,043,664
Net earnings (loss)
attributed to:
Circuit City Stock........ $ 13,269 $ 12,749 $ 32,147 $ 27,879 $ 15,945 $ 14,012 $ 87,020 $ 57,434 $ 148,381 $ 112,074
CarMax Stock .............. $ (736) $ (275) $ (685) $ (393) $ (1,701) $ (2,075) $ (2,335) $ (5,020) $ (5,457) $ (7,763)
Net earnings (loss)
per share:
Circuit City Stock:
Basic....................... $ 0.13 $ 0.13 $ 0.32 $ 0.28 $ 0.16 $ 0.14 $ 0.87 $ 0.58 $ 1.50 $ 1.14
Diluted................... $ 0.13 $ 0.13 $ 0.32 $ 0.28 $ 0.16 $ 0.14 $ 0.86 $ 0.58 $ 1.48 $ 1.13
CarMax Stock .............. $ (0.03) $ (0.01) $ (0.03) $ (0.02) $ (0.07) $ (0.09) $ (0.10) $ (0.23) $ (0.24) $ (0.35)