CarMax 1999 Annual Report Download - page 48
Download and view the complete annual report
Please find page 48 of the 1999 CarMax annual report below. You can navigate through the pages in the report by either clicking on the pages listed below, or by using the keyword search tool below to find specific information within the annual report.
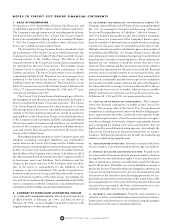
On January 24, 1997, shareholders of Circuit City Stores, Inc.
approved the creation of two common stock series. The
Company’s existing common stock was subsequently redesignated
as Circuit City Stores, Inc.–Circuit City Group Common Stock.
In an initial public offering, which was completed February 7,
1997, the Company sold 21.86 million shares of Circuit City
Stores, Inc.–CarMax Group Common Stock.
The Circuit City Group Common Stock is intended to track
the performance of the Circuit City store-related operations, the
Company’s investment in Digital Video Express and the Group’s
retained interest in the CarMax Group. The effects of this
retained interest on the Circuit City Group’s financial statements
are identified by the term “Inter-Group.”
The CarMax Group Common Stock is intended to track the
performance of the CarMax operations. The Inter-Group Interest
is not considered outstanding CarMax Group stock. Therefore,
any net earnings or loss attributed to the Inter-Group Interest is
not included in the CarMax Group’s per share calculations.
The following discussion and analysis relates to the Circuit City
Group. Reported earnings reflect the Circuit City Group’s 100
percent interest in the losses of the CarMax Group prior to the
consummation of the offering on February 7, 1997, and the lower
Inter-Group Interest since that time. For additional information,
refer to the “Management’s Discussion and Analysis of Results of
Operations and Financial Condition” for Circuit City Stores, Inc.
and for the CarMax Group.
RESULTS OF OPERATIONS
Sales Growth
Total sales for the Circuit City Group increased 17 percent in fiscal
1999 to $9.34 billion. In fiscal 1998, total sales were $8.00 billion,
a 12 percent increase from $7.15 billion in fiscal 1997.
PERCENTAGE SALES CHANGE FROM PRIOR YEAR
Circuit City Group
Fiscal Total Comparable Industry*
1999............................................ 17% 8)% 5)%
1998............................................ 12% (1)% (3)%
1997............................................ 6% (8)% (8)%
1996............................................ 23% 5)% 6)%
1995............................................ 34% 15)% 11)%
* The industry sales rates are derived from Electronic Industries Alliance, Recording
Industry Association of America and Company estimates of audio, video, home
office, telecommunications, appliance and music software sales.
The fiscal 1999 total sales increase reflects an 8 percent com-
parable store sales increase, which was in part caused by an accel-
eration in industry growth, and the continued geographic
expansion of the Group’s Circuit City Superstores. In fiscal 1999,
the Group opened 37 Superstores. The Group entered a number
of one- and two-store markets; added stores to existing markets,
including the New York metropolitan market that was entered in
fiscal 1998; replaced three Superstores; and closed two consumer
electronics-only stores. In addition, the Group remodeled 30
stores to reflect its most recent merchandising initiatives.
The Group operates four Circuit City Superstore formats
with square footage and merchandise assortments tailored to vol-
ume expectations for specific trade areas. The “D” format serves
the most populous trade areas. At the end of fiscal 1999, selling
space for the “D” format stores averaged about 23,000 square feet
and total square footage for all “D” stores averaged 43,042. The
“C” format constitutes the largest percentage of the store base. At
the end of fiscal 1999, selling space in the “C” format stores aver-
aged about 15,000 square feet with total square footage for all “C”
stores averaging 34,036. The “B” format often is located in smaller
markets or in smaller trade areas within larger metropolitan mar-
kets. At the end of fiscal 1999, selling space in these stores aver-
aged approximately 12,500 square feet with an average total
square footage of 26,651. The “B” stores offer a broad merchandise
assortment that maximizes return on investment in lower volume
areas. The “A” format serves the least populated trade areas.
Selling space for all “A” stores averaged approximately 9,500
square feet at the end of fiscal 1999, and total square footage aver-
aged 19,558. These stores feature a layout, staffing level and mer-
chandise assortment that creates high productivity in the smallest
markets.
The Group also operates 48 mall-based Circuit City Express
stores. These stores are located in regional malls and are approxi-
mately 2,000 to 3,000 square feet in size.
STORE MIX
Retail Units at Year-End
Fiscal 1999 1998 1997 1996 1995
Superstore
“D” Superstore............. 118 114 95 61 12
“C” Superstore............. 294 289 278 259 257
“B” Superstore............. 82 72 54 46 37
“A” Superstore............. 43 25 16 12 6
Electronics-Only.............. 2 4 5 5 5
Circuit City Express ......... 48 52 45 36 35
Total................................. 587 556 493 419 352
Industry sales in Circuit City’s retail segments have varied
significantly over the past five years, resulting in wide variations in
the Group’s sales growth. Geographic expansion and the addition
of product categories such as personal computers were the pri-
mary contributors to the Circuit City Group’s total sales growth
early in the period. From mid-fiscal 1996 through fiscal 1998, a
lack of significant product introductions resulted in lower average
retails and weak sales throughout the industry. In fiscal 1999, the
industry began to emerge from this period of declining sales. For
Circuit City, the fiscal 1999 sales reflected strong sales across all
major categories with especially strong sales in personal comput-
ers and in new high technology areas such as DIRECTV; wireless
communications; DVD players, especially players with the Divx
feature; and digital camcorders. The continued Superstore addi-
tions also contributed to the total sales growth.
The industry weakness in fiscal 1997 and 1998 resulted in a
highly competitive climate, and a significant number of regional
competitors closed stores. Despite the improvement in fiscal
46 CIRCUIT CITY STORES, INC. 1999 ANNUAL REPORT
CIRCUIT CITY GROUP MANAGEMENT’S DISCUSSION AND ANALYSIS
OF RESULTS OF OPERATIONS AND FINANCIAL CONDITION


