CarMax 1999 Annual Report Download - page 53
Download and view the complete annual report
Please find page 53 of the 1999 CarMax annual report below. You can navigate through the pages in the report by either clicking on the pages listed below, or by using the keyword search tool below to find specific information within the annual report.-
 1
1 -
2
-
3
-
4
-
5
-
6
-
7
-
8
-
9
-
10
-
11
-
12
-
13
-
14
-
15
-
16
-
17
-
18
-
19
-
20
-
21
-
22
-
23
-
24
-
25
-
26
-
27
-
28
-
29
-
30
-
31
-
32
-
33
-
34
-
35
-
36
-
37
-
38
-
39
-
40
-
41
-
42
-
 43
43 -
 44
44 -
 45
45 -
 46
46 -
 47
47 -
 48
48 -
 49
49 -
 50
50 -
 51
51 -
 52
52 -
 53
53 -
 54
54 -
 55
55 -
 56
56 -
 57
57 -
 58
58 -
 59
59 -
 60
60 -
 61
61 -
 62
62 -
 63
63 -
64
-
65
-
66
-
67
-
68
-
69
-
70
-
71
-
72
-
73
-
74
-
75
-
76
-
77
-
78
-
79
-
80
-
81
-
82
-
83
-
84
-
85
-
86
 |
 |

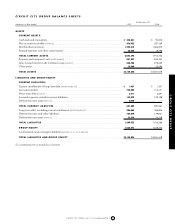
At February 28
(Amounts in thousands)
1999 1998
ASSETS
CURRENT ASSETS:
Cash and cash equivalents..............................................................................................................
$ 248,201
$90,200
Net accounts receivable [NOTE 12]....................................................................................................
476,952
537,169
Merchandise inventory...................................................................................................................
1,292,215
1,266,575
Prepaid expenses and other current assets......................................................................................
36,024
19,798
TOTAL CURRENT ASSETS............................................................................................................
2,053,392
1,913,742
Property and equipment, net [NOTES 4AND 5].....................................................................................
801,827
834,347
Inter-Group Interest in the CarMax Group [NOTE 2]........................................................................
260,758
278,239
Other assets....................................................................................................................................
18,849
35,290
TOTAL ASSETS..............................................................................................................................
$3,134,826
$3,061,618
LIABILITIES AND GROUP EQUITY
CURRENT LIABILITIES:
Current installments of long-term debt [NOTES 5AND 10]...................................................................
$ 1,457
$1,301
Accounts payable...........................................................................................................................
739,895
714,171
Short-term debt [NOTE 5].................................................................................................................
3,411
5,591
Accrued expenses and other current liabilities ...............................................................................
135,029
129,198
Deferred income taxes [NOTE 6].......................................................................................................
2,090
–
TOTAL CURRENT LIABILITIES....................................................................................................
881,882
850,261
Long-term debt, excluding current installments [NOTES 5AND 10] .....................................................
286,865
396,906
Deferred revenue and other liabilities ............................................................................................
107,070
139,841
Deferred income taxes [NOTE 6].......................................................................................................
33,536
26,278
TOTAL LIABILITIES ......................................................................................................................
1,309,353
1,413,286
GROUP EQUITY...........................................................................................................................
1,825,473
1,648,332
Commitments and contingent liabilities [NOTES 1, 9, 10, 12, 14 AND 15]
TOTAL LIABILITIES AND GROUP EQUITY ...............................................................................
$3,134,826
$3,061,618
See accompanying notes to group financial statements.
CIRCUIT CITY GROUP BALANCE SHEETS
CIRCUIT CITY GROUP
CIRCUIT CITY STORES, INC. 1999 ANNUAL REPORT 51