CarMax 1999 Annual Report Download - page 54
Download and view the complete annual report
Please find page 54 of the 1999 CarMax annual report below. You can navigate through the pages in the report by either clicking on the pages listed below, or by using the keyword search tool below to find specific information within the annual report.-
 1
1 -
2
-
3
-
4
-
5
-
6
-
7
-
8
-
9
-
10
-
11
-
12
-
13
-
14
-
15
-
16
-
17
-
18
-
19
-
20
-
21
-
22
-
23
-
24
-
25
-
26
-
27
-
28
-
29
-
30
-
31
-
32
-
33
-
34
-
35
-
36
-
37
-
38
-
39
-
40
-
41
-
42
-
43
-
 44
44 -
 45
45 -
 46
46 -
 47
47 -
 48
48 -
 49
49 -
 50
50 -
 51
51 -
 52
52 -
 53
53 -
 54
54 -
 55
55 -
 56
56 -
 57
57 -
 58
58 -
 59
59 -
 60
60 -
 61
61 -
 62
62 -
 63
63 -
 64
64 -
65
-
66
-
67
-
68
-
69
-
70
-
71
-
72
-
73
-
74
-
75
-
76
-
77
-
78
-
79
-
80
-
81
-
82
-
83
-
84
-
85
-
86
 |
 |

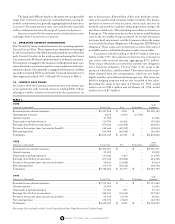
Years Ended February 28
(Amounts in thousands)
1999 1998 1997
OPERATING ACTIVITIES:
Net earnings .......................................................................................................
$ 148,381
$ 112,074 $ 136,680
Adjustments to reconcile net earnings to net cash
provided by operating activities:
Net loss related to Inter-Group Interest in the CarMax Group ......................
18,057
26,460 9,052
Depreciation and amortization......................................................................
130,290
111,749 97,313
Loss (gain) on sales of property and equipment .............................................
3,087
2,593 (1,540)
Provision for deferred income taxes...............................................................
9,348
16,919 19,307
Decrease in deferred revenue and other liabilities..........................................
(32,771)
(23,859) (48,863)
Decrease (increase) in net accounts receivable ..............................................
60,217
(33,545) (195,791)
(Increase) decrease in merchandise inventory, prepaid expenses
and other current assets ............................................................................
(41,866)
34,441 (42,676)
Decrease (increase) in other assets.................................................................
9,941
(5,032) (14,178)
Increase in accounts payable, accrued expenses and
other current liabilities..............................................................................
31,555
38,907 80,373
NET CASH PROVIDED BY OPERATING ACTIVITIES ...................................
336,239
280,707 39,677
INVESTING ACTIVITIES:
Purchases of property and equipment.................................................................
(228,672)
(353,800) (451,561)
Proceeds from sales of property and equipment..................................................
134,315
199,028 316,276
NET CASH USED IN INVESTING ACTIVITIES ..............................................
(94,357)
(154,772) (135,285)
FINANCING ACTIVITIES:
(Decrease) increase in allocated short-term debt, net .........................................
(2,180)
5,244 (73,690)
(Decrease) increase in inter-group payable.........................................................
–
(48,147) 48,147
(Decrease) increase in allocated long-term debt, net ..........................................
(109,885)
(33,573) 109,702
Equity issuances, net ...........................................................................................
42,165
22,311 15,385
Dividends paid....................................................................................................
(13,981)
(13,792) (13,199)
NET CASH (USED IN) PROVIDED BY FINANCING ACTIVITIES................
(83,881)
(67,957) 86,345
Increase (decrease) in cash and cash equivalents......................................................
158,001
57,978 (9,263)
Cash and cash equivalents at beginning of year .......................................................
90,200
32,222 41,485
Cash and cash equivalents at end of year .................................................................
$ 248,201
$90,200 $ 32,222
See accompanying notes to group financial statements.
CIRCUIT CITY GROUP STATEMENTS OF CASH FLOWS
52 CIRCUIT CITY STORES, INC. 1999 ANNUAL REPORT