CarMax 1999 Annual Report Download - page 25
Download and view the complete annual report
Please find page 25 of the 1999 CarMax annual report below. You can navigate through the pages in the report by either clicking on the pages listed below, or by using the keyword search tool below to find specific information within the annual report.-
 1
1 -
2
-
3
-
4
-
5
-
6
-
7
-
8
-
9
-
10
-
11
-
12
-
13
-
14
-
 15
15 -
 16
16 -
 17
17 -
 18
18 -
 19
19 -
 20
20 -
 21
21 -
 22
22 -
 23
23 -
 24
24 -
 25
25 -
 26
26 -
 27
27 -
 28
28 -
 29
29 -
 30
30 -
 31
31 -
 32
32 -
 33
33 -
 34
34 -
 35
35 -
36
-
37
-
38
-
39
-
40
-
41
-
42
-
43
-
44
-
45
-
46
-
47
-
48
-
49
-
50
-
51
-
52
-
53
-
54
-
55
-
56
-
57
-
58
-
59
-
60
-
61
-
62
-
63
-
64
-
65
-
66
-
67
-
68
-
69
-
70
-
71
-
72
-
73
-
74
-
75
-
76
-
77
-
78
-
79
-
80
-
81
-
82
-
83
-
84
-
85
-
86
 |
 |

On January 24, 1997, shareholders of Circuit City Stores, Inc.
approved the creation of two common stock series. The
Company’s existing common stock was subsequently redesignated
as Circuit City Stores, Inc.–Circuit City Group Common Stock.
In an initial public offering, which was completed February 7,
1997, the Company sold 21.86 million shares of Circuit City
Stores, Inc.–CarMax Group Common Stock.
The Circuit City Group Common Stock is intended to track
the performance of the Circuit City store-related operations, the
Company’s investment in Digital Video Express and the Group’s
retained interest in the CarMax Group. The effects of this
retained interest on the Circuit City Group’s financial statements
are identified by the term “Inter-Group.”
The CarMax Group Common Stock is intended to track the
performance of the CarMax operations. The Inter-Group Interest
is not considered outstanding CarMax Group stock. Therefore,
any net earnings or loss attributed to the Inter-Group Interest is
not included in the CarMax Group’s per share calculations.
The following discussion and analysis refers to Circuit City
Stores, Inc., which includes the operations related to both the
Circuit City Group and the CarMax Group. All financial state-
ments reflect consummation of the CarMax Group stock offering
on February 7, 1997. For additional information, refer to the
“Management’s Discussion and Analysis of Results of Operations
and Financial Condition” for the Circuit City Group and for the
CarMax Group.
RESULTS OF OPERATIONS
Sales Growth
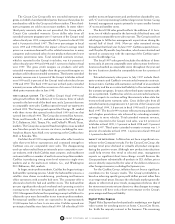
Total sales for Circuit City Stores, Inc. increased 22 percent in fiscal
1999 to $10.80 billion. In fiscal 1998, total sales were $8.87 bil-
lion, a 16 percent increase from $7.66 billion in fiscal 1997.
PERCENTAGE SALES CHANGE FROM PRIOR YEAR
Circuit City Circuit City CarMax
Stores, Inc. Group Group
Fiscal Total Total Comparable Total Comparable
1999 ............ 22% 17% 8)% 68% (2)%
1998 ............ 16% 12% (1)% 71% 6)%
1997 ............ 9% 6% (8)% 85% 23)%
1996 ............ 26% 23% 5)% 258% 12)%
1995 ............ 35% 34% 15)% 376% 43)%
THE CIRCUIT CITY GROUP.
Industry sales in Circuit City’s retail
segments have varied significantly over the past five years, result-
ing in wide variations in the Group’s sales growth. Geographic
expansion and the addition of product categories such as personal
computers were the primary contributors to the Circuit City
Group’s total sales growth early in the period. From mid-fiscal
1996 through fiscal 1998, a lack of significant product introduc-
tions resulted in lower average retails and weak sales throughout
the industry. In fiscal 1999, the industry began to emerge from this
period of declining sales. For Circuit City, the fiscal 1999 sales
reflected strong sales across all major categories with especially
strong sales in personal computers and new high technology areas
such as DIRECTV; wireless communications; DVD players, espe-
cially players with the Divx feature; and digital camcorders. The
addition of 37 Superstores also contributed to the total sales
growth.
The industry weakness in fiscal 1997 and 1998 resulted in a
highly competitive climate, and a significant number of regional
competitors closed stores. Despite the improvement in fiscal
1999, the consumer electronics industry remains highly competi-
tive. Circuit City’s primary competitors are large specialty, dis-
count or warehouse retailers with generally lower levels of service.
Because of Circuit City’s long history of providing exceptional
customer service, management believes that the Circuit City loca-
tions can continue to maintain share in existing markets and build
comparable shares in new markets.
CIRCUIT CITY STORES, INC.
CIRCUIT CITY STORES, INC. 1999 ANNUAL REPORT 23
CIRCUIT CITY STORES, INC. MANAGEMENT’S DISCUSSION AND ANALYSIS
OF RESULTS OF OPERATIONS AND FINANCIAL CONDITION
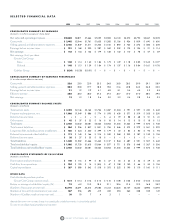
REPORTED HISTORICAL INFORMATION
(Amounts in thousands except per share data)
1999 1998 1997 1996 1995
Net sales and operating revenues..................................................
$10,804,447
$8,870,797 $7,663,811 $7,029,123 $5,582,947
Net earnings.................................................................................
$ 142,924
$ 104,311 $ 136,414 $ 179,375 $ 167,875
Net earnings (loss) per share:
Circuit City Group:
Basic ...................................................................................
$ 1.50
$ 1.14 $ 1.40 $ 1.86 $ 1.75
Diluted...............................................................................
$ 1.48
$ 1.13 $ 1.39 $ 1.84 $ 1.74
CarMax Group........................................................................
$ (0.24)
$ (0.35) $ (0.01) $ – $ –
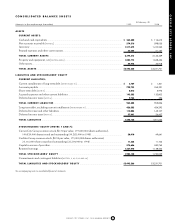
Total assets ...................................................................................
$ 3,445,266
$3,231,701 $3,081,173 $2,526,022 $2,004,055
Long-term debt, excluding current installments...........................
$ 426,585
$ 424,292 $ 430,290 $ 399,161 $ 178,605
Deferred revenue and other liabilities ..........................................
$ 112,085
$ 145,107 $ 166,295 $ 214,001 $ 241,866
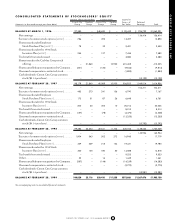
Cash dividends per share paid on
Circuit City Group common stock..........................................
$ 0.14
$ 0.14 $ 0.14 $ 0.12 $ 0.10
See notes to consolidated financial statements.