CarMax 1999 Annual Report Download - page 55
Download and view the complete annual report
Please find page 55 of the 1999 CarMax annual report below. You can navigate through the pages in the report by either clicking on the pages listed below, or by using the keyword search tool below to find specific information within the annual report.-
 1
1 -
2
-
3
-
4
-
5
-
6
-
7
-
8
-
9
-
10
-
11
-
12
-
13
-
14
-
15
-
16
-
17
-
18
-
19
-
20
-
21
-
22
-
23
-
24
-
25
-
26
-
27
-
28
-
29
-
30
-
31
-
32
-
33
-
34
-
35
-
36
-
37
-
38
-
39
-
40
-
41
-
42
-
43
-
44
-
 45
45 -
 46
46 -
 47
47 -
 48
48 -
 49
49 -
 50
50 -
 51
51 -
 52
52 -
 53
53 -
 54
54 -
 55
55 -
 56
56 -
 57
57 -
 58
58 -
 59
59 -
 60
60 -
 61
61 -
 62
62 -
 63
63 -
 64
64 -
 65
65 -
66
-
67
-
68
-
69
-
70
-
71
-
72
-
73
-
74
-
75
-
76
-
77
-
78
-
79
-
80
-
81
-
82
-
83
-
84
-
85
-
86
 |
 |

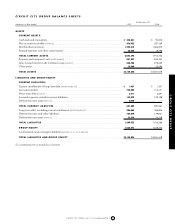
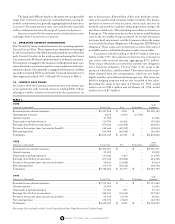
(Amounts in thousands)
BALANCE AT MARCH 1, 1996............................................................................................................................................... $1,063,921
Net earnings........................................................................................................................................................................... 136,680
Equity issuances, net .............................................................................................................................................................. 15,385
Cash dividends....................................................................................................................................................................... (13,199)
Inter-Group Interest adjustment resulting from the offering [NOTE 2]...................................................................................... 323,910
BALANCE AT FEBRUARY 28, 1997....................................................................................................................................... 1,526,697
Net earnings........................................................................................................................................................................... 112,074
Equity issuances, net .............................................................................................................................................................. 22,311
Cash dividends....................................................................................................................................................................... (13,792)
Inter-Group Interest adjustment [NOTE 2] ................................................................................................................................ 1,042
BALANCE AT FEBRUARY 28, 1998....................................................................................................................................... 1,648,332
Net earnings........................................................................................................................................................................... 148,381
Equity issuances, net .............................................................................................................................................................. 42,165
Cash dividends....................................................................................................................................................................... (13,981)
Inter-Group Interest adjustment [NOTE 2] ................................................................................................................................ 576
BALANCE AT FEBRUARY 28, 1999.......................................................................................................................................
$1,825,473
See accompanying notes to group financial statements.
CIRCUIT CITY GROUP STATEMENTS OF GROUP EQUITY
CIRCUIT CITY GROUP
CIRCUIT CITY STORES, INC. 1999 ANNUAL REPORT 53