CarMax 1999 Annual Report Download - page 34
Download and view the complete annual report
Please find page 34 of the 1999 CarMax annual report below. You can navigate through the pages in the report by either clicking on the pages listed below, or by using the keyword search tool below to find specific information within the annual report.-
 1
1 -
2
-
3
-
4
-
5
-
6
-
7
-
8
-
9
-
10
-
11
-
12
-
13
-
14
-
15
-
16
-
17
-
18
-
19
-
20
-
21
-
22
-
23
-
 24
24 -
 25
25 -
 26
26 -
 27
27 -
 28
28 -
 29
29 -
 30
30 -
 31
31 -
 32
32 -
 33
33 -
 34
34 -
 35
35 -
 36
36 -
 37
37 -
 38
38 -
 39
39 -
 40
40 -
 41
41 -
 42
42 -
 43
43 -
 44
44 -
45
-
46
-
47
-
48
-
49
-
50
-
51
-
52
-
53
-
54
-
55
-
56
-
57
-
58
-
59
-
60
-
61
-
62
-
63
-
64
-
65
-
66
-
67
-
68
-
69
-
70
-
71
-
72
-
73
-
74
-
75
-
76
-
77
-
78
-
79
-
80
-
81
-
82
-
83
-
84
-
85
-
86
 |
 |
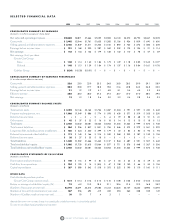
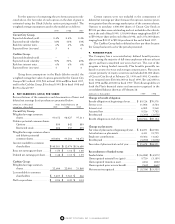
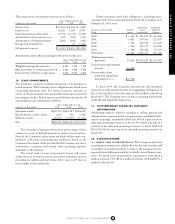
Years Ended February 28
(Amounts in thousands)
1999 1998 1997
OPERATING ACTIVITIES:
Net earnings........................................................................................................
$ 142,924
$104,311 $ 136,414
Adjustments to reconcile net earnings to net cash
provided by operating activities:
Depreciation and amortization......................................................................
140,293
116,326 98,977
Loss (gain) on disposition of property and equipment...................................
3,087
14,093 (1,540)
Provision for deferred income taxes...............................................................
20,632
15,052 20,973
Changes in operating assets and liabilities, net of effects
from business acquisitions:
Decrease in deferred revenue and other liabilities.....................................
(33,022)
(23,024) (47,706)
Decrease (increase) in net accounts receivable .........................................
23,719
(66,061) (207,579)
Increase in inventory, prepaid expenses and other current assets..............
(97,642)
(24,526) (66,594)
Decrease (increase) in other assets............................................................
9,132
(4,969) (15,869)
Increase in accounts payable, accrued expenses and
other current liabilities.........................................................................
45,125
63,379 97,162
NET CASH PROVIDED BY OPERATING ACTIVITIES ...................................
254,248
194,581 14,238
INVESTING ACTIVITIES:
Cash used in business acquisitions [NOTE 3]..........................................................
(41,562)
– –
Purchases of property and equipment.................................................................
(366,971)
(588,052) (541,989)
Proceeds from sales of property and equipment..................................................
273,647
297,126 332,726
NET CASH USED IN INVESTING ACTIVITIES ..............................................
(134,886)
(290,926) (209,263)
FINANCING ACTIVITIES:
(Payments on) proceeds from issuance of short-term debt, net...........................
(960)
5,629 (91,740)
Proceeds from issuance of long-term debt ..........................................................
–
–32,619
Principal payments on long-term debt................................................................
(1,301)
(6,187) (1,436)
Issuances of Circuit City Group common stock, net...........................................
42,165
22,311 15,385
Issuances of CarMax Group common stock, net .................................................
3,983
2,353 412,335
Dividends paid on Circuit City Group common stock........................................
(13,981)
(13,792) (13,199)
NET CASH PROVIDED BY FINANCING ACTIVITIES ...................................
29,906
10,314 353,964
Increase (decrease) in cash and cash equivalents......................................................
149,268
(86,031) 158,939
Cash and cash equivalents at beginning of year .......................................................
116,612
202,643 43,704
Cash and cash equivalents at end of year .................................................................
$ 265,880
$116,612 $ 202,643
SUPPLEMENTAL DISCLOSURES OF CASH FLOW INFORMATION
Cash paid during the year for:
Interest................................................................................................................
$ 31,858
$26,697 $ 29,925
Income taxes .......................................................................................................
$ 53,528
$47,936 $ 73,113
See accompanying notes to consolidated financial statements.
CONSOLIDATED STATEMENTS OF CASH FLOWS
32 CIRCUIT CITY STORES, INC. 1999 ANNUAL REPORT