CarMax 1999 Annual Report Download - page 70
Download and view the complete annual report
Please find page 70 of the 1999 CarMax annual report below. You can navigate through the pages in the report by either clicking on the pages listed below, or by using the keyword search tool below to find specific information within the annual report.-
 1
1 -
2
-
3
-
4
-
5
-
6
-
7
-
8
-
9
-
10
-
11
-
12
-
13
-
14
-
15
-
16
-
17
-
18
-
19
-
20
-
21
-
22
-
23
-
24
-
25
-
26
-
27
-
28
-
29
-
30
-
31
-
32
-
33
-
34
-
35
-
36
-
37
-
38
-
39
-
40
-
41
-
42
-
43
-
44
-
45
-
46
-
47
-
48
-
49
-
50
-
51
-
52
-
53
-
54
-
55
-
56
-
57
-
58
-
59
-
 60
60 -
 61
61 -
 62
62 -
 63
63 -
 64
64 -
 65
65 -
 66
66 -
 67
67 -
 68
68 -
 69
69 -
 70
70 -
 71
71 -
 72
72 -
 73
73 -
 74
74 -
 75
75 -
 76
76 -
 77
77 -
 78
78 -
 79
79 -
 80
80 -
81
-
82
-
83
-
84
-
85
-
86
 |
 |
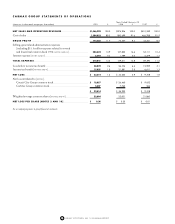
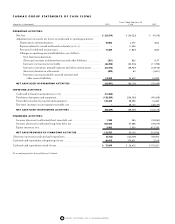
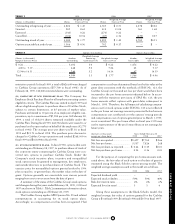
Years Ended February 28
(Amounts in thousands except per share data)
1999 % 1998 % 1997 %
NET SALES AND OPERATING REVENUES ......................................
$1,466,298
100.0 $874,206 100.0 $510,249 100.0
Cost of sales ..........................................................................................
1,294,032
88.3 800,699 91.6 466,788 91.5
GROSS PROFIT ...................................................................................
172,266
11.7 73,507 8.4 43,461 8.5
Selling, general and administrative expenses
[including $11.5 million expense related to owned
and leased real estate in fiscal 1998. NOTES 3AND 13]............................
204,422
13.9 127,822 14.6 53,111 10.4
Interest expense [NOTES 3AND 7]...............................................................
6,393
0.4 1,789 0.2 6,279 1.2
TOTAL EXPENSES...............................................................................
210,815
14.3 129,611 14.8 59,390 11.6
Loss before income tax benefit ..............................................................
38,549
2.6 56,104 6.4 15,929 3.1
Income tax benefit [NOTES 3AND 8]...........................................................
15,035
1.0 21,881 2.5 6,611 1.3
NET LOSS.............................................................................................
$ 23,514
1.6 $ 34,223 3.9 $ 9,318 1.8
Net loss attributed to [NOTE 1]:
Circuit City Group common stock ..................................................
$ 18,057
$26,460 $ 9,052
CarMax Group common stock.........................................................
5,457
7,763 266
$23,514
$34,223 $ 9,318
Weighted average common shares [NOTES 2AND 10].................................
22,604
22,001 21,860
NET LOSS PER SHARE [NOTES 2 AND 10]....................................
$0.24
$0.35 $ 0.01
See accompanying notes to group financial statements.
CARMAX GROUP STATEMENTS OF OPERATIONS
68 CIRCUIT CITY STORES, INC. 1999 ANNUAL REPORT