CVS 2014 Annual Report Download - page 80
Download and view the complete annual report
Please find page 80 of the 2014 CVS annual report below. You can navigate through the pages in the report by either clicking on the pages listed below, or by using the keyword search tool below to find specific information within the annual report.-
 1
1 -
2
-
3
-
4
-
5
-
6
-
7
-
8
-
9
-
10
-
11
-
12
-
13
-
14
-
15
-
16
-
17
-
18
-
19
-
20
-
21
-
22
-
23
-
24
-
25
-
26
-
27
-
28
-
29
-
30
-
31
-
32
-
33
-
34
-
35
-
36
-
37
-
38
-
39
-
40
-
41
-
42
-
43
-
44
-
45
-
46
-
47
-
48
-
49
-
50
-
51
-
52
-
53
-
54
-
55
-
56
-
57
-
58
-
59
-
60
-
61
-
62
-
63
-
64
-
65
-
66
-
67
-
68
-
69
-
 70
70 -
 71
71 -
 72
72 -
 73
73 -
 74
74 -
 75
75 -
 76
76 -
 77
77 -
 78
78 -
 79
79 -
 80
80 -
 81
81 -
 82
82 -
 83
83 -
 84
84 -
 85
85 -
 86
86 -
 87
87 -
 88
88 -
 89
89 -
 90
90 -
91
-
92
-
93
-
94
 |
 |

CVS Health
78
Notes to Consolidated Financial Statements
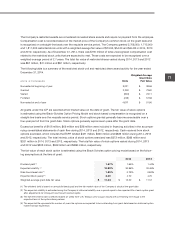
As of December 31, 2014, unrecognized compensation expense related to unvested options totaled $121 million,
which the Company expects to be recognized over a weighted-average period of 1.7 years. After considering
anticipated forfeitures, the Company expects approximately 16 million of the unvested stock options to vest over
the requisite service period.
The following table is a summary of the Company’s stock option activity for the year ended December 31, 2014:
Weighted Average
Weighted Average Remaining Aggregate
SHARES IN THOUSANDS Shares Exercise Price Contractual Term Intrinsic Value
Outstanding at December 31, 2013 34,738 $ 41.40
Granted 4,525 $ 74.96
Exercised (9,563) $ 37.30
Forfeited (1,202) $ 50.15
Expired (332) $ 36.93
Outstanding at December 31, 2014 28,166 $ 47.87 4.15 $ 1,364,408,886
Exercisable at December 31, 2014 11,634 $ 37.86 2.82 $ 679,995,090
Vested at December 31, 2014 and expected
to vest in the future 27,394 $ 47.51 4.11 $ 1,336,774,863
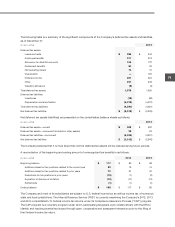
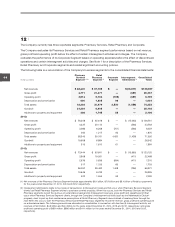
10 | Income Taxes
The income tax provision for continuing operations consisted of the following for the years ended December 31:
IN MILLIONS 2014 2013 2012
Current:
Federal
$ 2,581
$ 2,623 $ 2,226
State
495
437 410
3,076
3,060 2,636
Deferred:
Federal
(43)
(115) (182)
State
—
(17) (18)
(43)
(132) (200)
Total
$ 3,033
$ 2,928 $ 2,436
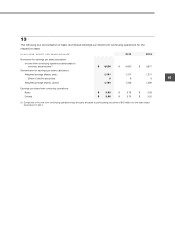
The following table is a reconciliation of the statutory income tax rate to the Company’s effective income tax rate for
continuing operations for the years ended December 31:
2014 2013 2012
Statutory income tax rate
35.0 %
35.0 % 35.0 %
State income taxes, net of federal tax benefit
4.3
4.0 3.9
Other
0.2
(0.1) (0.3)
Effective income tax rate
39.5 %
38.9 % 38.6 %