CVS 2014 Annual Report Download - page 34
Download and view the complete annual report
Please find page 34 of the 2014 CVS annual report below. You can navigate through the pages in the report by either clicking on the pages listed below, or by using the keyword search tool below to find specific information within the annual report.-
 1
1 -
2
-
3
-
4
-
5
-
6
-
7
-
8
-
9
-
10
-
11
-
12
-
13
-
14
-
15
-
16
-
17
-
18
-
19
-
20
-
21
-
22
-
23
-
 24
24 -
 25
25 -
 26
26 -
 27
27 -
 28
28 -
 29
29 -
 30
30 -
 31
31 -
 32
32 -
 33
33 -
 34
34 -
 35
35 -
 36
36 -
 37
37 -
 38
38 -
 39
39 -
 40
40 -
 41
41 -
 42
42 -
 43
43 -
 44
44 -
45
-
46
-
47
-
48
-
49
-
50
-
51
-
52
-
53
-
54
-
55
-
56
-
57
-
58
-
59
-
60
-
61
-
62
-
63
-
64
-
65
-
66
-
67
-
68
-
69
-
70
-
71
-
72
-
73
-
74
-
75
-
76
-
77
-
78
-
79
-
80
-
81
-
82
-
83
-
84
-
85
-
86
-
87
-
88
-
89
-
90
-
91
-
92
-
93
-
94
 |
 |

Management’s Discussion and Analysis
of Financial Condition and Results of Operations
32
CVS Health
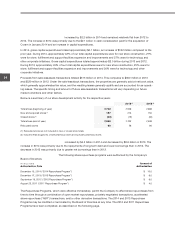
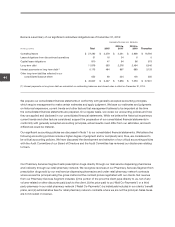
Retail Pharmacy Segment
The following table summarizes our Retail Pharmacy Segment’s performance for the respective periods:
YEAR ENDED DECEMBER 31,
IN MILLIONS
2014 2013 2012
Net revenues
$ 67,798
$ 65,618 $ 63,641
Gross profit
$ 21,277
$ 20,112 $ 19,091
Gross profit % of net revenues
31.4 %
30.6 % 30.0 %
Operating expenses
$ 14,515
$ 13,844 $ 13,455
Operating expenses % of net revenues
21.4 %
21.1 % 21.1 %
Operating profit
$ 6,762
$ 6,268 $ 5,636
Operating profit % of net revenues
10.0 %
9.6 % 8.9 %
Retail prescriptions filled (90 Day = 3 prescriptions) (1)
935.9
890.1 845.8
Net revenue increase (decrease):
Total
3.3 %
3.1 % 6.8 %
Pharmacy
5.1 %
4.1 % 7.6 %
Front Store
(2.5) %
1.0 % 5.1 %
Total prescription volume (90 Day = 3 prescriptions) (1)
5.2 %
5.2 % 11.0 %
Same store sales increase (decrease):
Total
2.1 %
1.7 % 5.6 %
Pharmacy
4.8 %
2.6 % 6.6 %
Front Store
(4.0) %
(0.5) % 3.4 %
Prescription volume (90 Day = 3 prescriptions) (1)
4.1 %
4.4 % 10.0 %
Generic dispensing rates
83.1 %
81.4 % 79.2 %
Pharmacy % of net revenues
70.7 %
69.5 % 68.8 %
Third party % of pharmacy revenue
98.6 %
97.9 % 97.5 %
(1) Includes the adjustment to convert 90-day, non-specialty prescriptions to the equivalent of three 30-day prescriptions. This adjustment
reflects the fact that these prescriptions include approximately three times the amount of product days supplied compared to a normal
prescription.
Net revenues
increased approximately $2.2 billion, or 3.3%, to $67.8 billion for the year ended December 31, 2014,
as compared to the prior year. This increase was primarily driven by a same store sales increase of 2.1% and net
revenues from new and acquired stores, which accounted for approximately 110 basis points of our total net
revenue percentage increase during the year. Net revenues increased $2.0 billion, or 3.1% to $65.6 billion for the
year ended December 31, 2013, as compared to the prior year. This increase was primarily driven by a same store
sales increase of 1.7% and net revenues from new stores, which accounted for approximately 130 basis points of
our total net revenue percentage increase during the year. Additionally, in 2014, 2013 and 2012 we continued to see
a positive impact on our net revenues due to the growth of our Maintenance Choice program.
As you review our Retail Pharmacy Segment’s performance in this area, we believe you should consider the follow-
ing important information:
• Front store same store sales declined 4.0% in the year ended December 31, 2014, as compared to the prior year.
The decrease is primarily due to the Company’s decision to stop selling tobacco products, softer customer traffic
and a less severe flu season than the prior year and extreme weather conditions across much of the United States
during the first quarter of 2014. The decrease was partially offset by an increase in basket size. Front store same