CVS 2014 Annual Report Download - page 62
Download and view the complete annual report
Please find page 62 of the 2014 CVS annual report below. You can navigate through the pages in the report by either clicking on the pages listed below, or by using the keyword search tool below to find specific information within the annual report.-
 1
1 -
2
-
3
-
4
-
5
-
6
-
7
-
8
-
9
-
10
-
11
-
12
-
13
-
14
-
15
-
16
-
17
-
18
-
19
-
20
-
21
-
22
-
23
-
24
-
25
-
26
-
27
-
28
-
29
-
30
-
31
-
32
-
33
-
34
-
35
-
36
-
37
-
38
-
39
-
40
-
41
-
42
-
43
-
44
-
45
-
46
-
47
-
48
-
49
-
50
-
51
-
 52
52 -
 53
53 -
 54
54 -
 55
55 -
 56
56 -
 57
57 -
 58
58 -
 59
59 -
 60
60 -
 61
61 -
 62
62 -
 63
63 -
 64
64 -
 65
65 -
 66
66 -
 67
67 -
 68
68 -
 69
69 -
 70
70 -
 71
71 -
 72
72 -
73
-
74
-
75
-
76
-
77
-
78
-
79
-
80
-
81
-
82
-
83
-
84
-
85
-
86
-
87
-
88
-
89
-
90
-
91
-
92
-
93
-
94
 |
 |

CVS Health
60
Notes to Consolidated Financial Statements
validate the inventory balances on hand in each distribution center and mail facility to ensure that the amounts
reflected in the accompanying consolidated financial statements are properly stated. During the interim period
between physical inventory counts, the Company accrues for anticipated physical inventory losses on a loca-
tion-by-location basis based on historical results and current trends.
Property and equipment — Property, equipment and improvements to leased premises are depreciated using the
straight-line method over the estimated useful lives of the assets, or when applicable, the term of the lease, which-
ever is shorter. Estimated useful lives generally range from 10 to 40 years for buildings, building improvements and
leasehold improvements and 3 to 10 years for fixtures, equipment and internally developed software. Repair and
maintenance costs are charged directly to expense as incurred. Major renewals or replacements that substantially
extend the useful life of an asset are capitalized and depreciated. Application development stage costs for signifi-
cant internally developed software projects are capitalized and depreciated.
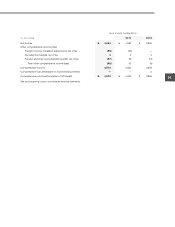
The following are the components of property and equipment at December 31:
IN MILLIONS 2014 2013
Land
$ 1,506
$ 1,460
Building and improvements
2,828
2,694
Fixtures and equipment
8,958
8,419
Leasehold improvements
3,626
3,320
Software
1,868
1,515
18,786
17,408
Accumulated depreciation and amortization
(9,943)
(8,793)
Property and equipment, net
$ 8,843
$ 8,615
The gross amount of property and equipment under capital leases was $268 million and $260 million as of
December 31, 2014 and 2013, respectively. Accumulated amortization of property and equipment under capital
lease was $86 million and $74 million as of December 31, 2014 and 2013, respectively. Amortization of property and
equipment under capital lease is included within depreciation expense. Depreciation expense totaled $1.4 billion in
2014 and 2013, and $1.3 billion in 2012.
Goodwill and other indefinitely-lived assets — Goodwill and other indefinitely-lived assets are not amortized,
but are subject to impairment reviews annually, or more frequently if necessary. See Note 3 for additional information
on goodwill and other indefinitely-lived assets.
Intangible assets — Purchased customer contracts and relationships are amortized on a straight-line basis over
their estimated useful lives between 10 and 20 years. Purchased customer lists are amortized on a straight-line
basis over their estimated useful lives of up to 10 years. Purchased leases are amortized on a straight-line basis
over the remaining life of the lease. See Note 3 for additional information about intangible assets.
Impairment of long-lived assets — The Company groups and evaluates fixed and finite-lived intangible assets
for impairment at the lowest level at which individual cash flows can be identified, whenever events or changes in
circumstances indicate that the carrying value of an asset may not be recoverable. If indicators of impairment are
present, the Company first compares the carrying amount of the asset group to the estimated future cash flows
associated with the asset group (undiscounted and without interest charges). If the estimated future cash flows used
in this analysis are less than the carrying amount of the asset group, an impairment loss calculation is prepared. The
impairment loss calculation compares the carrying amount of the asset group to the asset group’s estimated future
cash flows (discounted and with interest charges). If required, an impairment loss is recorded for the portion of the
asset group’s carrying value that exceeds the asset group’s estimated future cash flows (discounted and with
interest charges).