CVS 2014 Annual Report Download - page 71
Download and view the complete annual report
Please find page 71 of the 2014 CVS annual report below. You can navigate through the pages in the report by either clicking on the pages listed below, or by using the keyword search tool below to find specific information within the annual report.-
 1
1 -
2
-
3
-
4
-
5
-
6
-
7
-
8
-
9
-
10
-
11
-
12
-
13
-
14
-
15
-
16
-
17
-
18
-
19
-
20
-
21
-
22
-
23
-
24
-
25
-
26
-
27
-
28
-
29
-
30
-
31
-
32
-
33
-
34
-
35
-
36
-
37
-
38
-
39
-
40
-
41
-
42
-
43
-
44
-
45
-
46
-
47
-
48
-
49
-
50
-
51
-
52
-
53
-
54
-
55
-
56
-
57
-
58
-
59
-
60
-
 61
61 -
 62
62 -
 63
63 -
 64
64 -
 65
65 -
 66
66 -
 67
67 -
 68
68 -
 69
69 -
 70
70 -
 71
71 -
 72
72 -
 73
73 -
 74
74 -
 75
75 -
 76
76 -
 77
77 -
 78
78 -
 79
79 -
 80
80 -
 81
81 -
82
-
83
-
84
-
85
-
86
-
87
-
88
-
89
-
90
-
91
-
92
-
93
-
94
 |
 |
69
2014 Annual Report
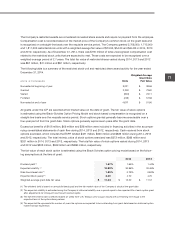
The Company amortizes intangible assets with finite lives over the estimated useful lives of the respective assets,
which have a weighted average useful life of 13.6 years. The weighted average useful lives of the Company’s
customer contracts and relationships and covenants not to compete are 13.2 years. The weighted average lives
of the Company’s favorable leases and other intangible assets are 16.3 years. Amortization expense for intangible
assets totaled $518 million, $494 million and $486 million in 2014, 2013 and 2012, respectively. The anticipated
annual amortization expense for these intangible assets for the next five years is as follows:
IN MILLIONS
2015 $ 486
2016 $ 456
2017 $ 433
2018 $ 415
2019 $ 383
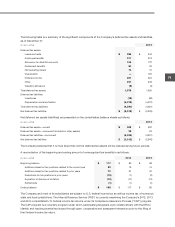
The following table is a summary of the Company’s intangible assets as of December 31:
2014 2013
Gross Net Gross Net
Carrying Accumulated Carrying Carrying Accumulated Carrying
IN MILLIONS Amount Amortization Amount Amount Amortization Amount
Trademark (indefinitely-lived)
$ 6,398 $ — $ 6,398
$ 6,398 $ — $ 6,398
Customer contracts and relationships
and covenants not to compete
6,521
(3,549) 2,972
5,840 (3,083) 2,757
Favorable leases and other
880
(476) 404
800 (426) 374
$ 13,799
$ (4,025) $ 9,774
$ 13,038 $ (3,509) $ 9,529
4 | Share Repurchase Programs
The following share repurchase programs were authorized by the Company’s Board of Directors:
Authorization Date
IN BILLIONS Amount of Authorization
December 15, 2014 (“2014 Repurchase Program”) $ 10.0
December 17, 2013 (“2013 Repurchase Program”) $ 6.0
September 19, 2012 (“2012 Repurchase Program”) $ 6.0
August 23, 2011 (“2011 Repurchase Program”) $ 4.0
The share Repurchase Programs, each of which was effective immediately, permit the Company to effect repurchases
from time to time through a combination of open market repurchases, privately negotiated transactions, accelerated
share repurchase (“ASR”) transactions, and/or other derivative transactions. The 2014 and 2013 Repurchase Programs
may be modified or terminated by the Board of Directors at any time. The 2012 and 2011 Repurchase Programs
have been completed, as described below.
Pursuant to the authorization under the 2013 Repurchase Programs, effective January 2, 2015, the Company entered
into a $2.0 billion fixed dollar ASR agreement with J.P. Morgan Chase Bank (“JP Morgan”). Upon payment of the
$2.0 billion purchase price on January 5, 2015, the Company received a number of shares of its common stock
equal to 80% of the $2.0 billion notional amount of the ASR agreement or approximately 16.8 million shares at a
price of $94.49 per share. At the conclusion of the ASR program, the Company may receive additional shares equal