CVS 2014 Annual Report Download - page 30
Download and view the complete annual report
Please find page 30 of the 2014 CVS annual report below. You can navigate through the pages in the report by either clicking on the pages listed below, or by using the keyword search tool below to find specific information within the annual report.-
 1
1 -
2
-
3
-
4
-
5
-
6
-
7
-
8
-
9
-
10
-
11
-
12
-
13
-
14
-
15
-
16
-
17
-
18
-
19
-
 20
20 -
 21
21 -
 22
22 -
 23
23 -
 24
24 -
 25
25 -
 26
26 -
 27
27 -
 28
28 -
 29
29 -
 30
30 -
 31
31 -
 32
32 -
 33
33 -
 34
34 -
 35
35 -
 36
36 -
 37
37 -
 38
38 -
 39
39 -
 40
40 -
41
-
42
-
43
-
44
-
45
-
46
-
47
-
48
-
49
-
50
-
51
-
52
-
53
-
54
-
55
-
56
-
57
-
58
-
59
-
60
-
61
-
62
-
63
-
64
-
65
-
66
-
67
-
68
-
69
-
70
-
71
-
72
-
73
-
74
-
75
-
76
-
77
-
78
-
79
-
80
-
81
-
82
-
83
-
84
-
85
-
86
-
87
-
88
-
89
-
90
-
91
-
92
-
93
-
94
 |
 |

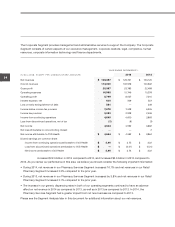
Management’s Discussion and Analysis
of Financial Condition and Results of Operations
28
CVS Health
Pharmacy Services Segment
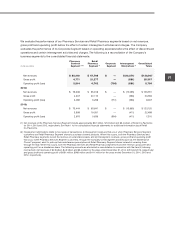
The following table summarizes our Pharmacy Services Segment’s performance for the respective periods:
YEAR ENDED DECEMBER 31,
IN MILLIONS
2014 2013 2012
Net revenues
$ 88,440
$ 76,208 $ 73,444
Gross profit
$ 4,771
$ 4,237 $ 3,808
Gross profit % of net revenues
5.4 %
5.6 % 5.2 %
Operating expenses
$ 1,257
$ 1,151 $ 1,129
Operating expenses % of net revenues
1.4 %
1.5 % 1.5 %
Operating profit
$ 3,514
$ 3,086 $ 2,679
Operating profit % of net revenues
4.0 %
4.1 % 3.6 %
Net revenues (1):
Mail choice (2)
$ 31,081
$ 24,791 $ 22,843
Pharmacy network (3)
$ 57,122
$ 51,211 $ 50,411
Other
$ 237
$ 206 $ 190
Pharmacy claims processed (1):
Total
932.0
902.1 880.5
Mail choice (2)
82.4
83.3 81.7
Pharmacy network (3)
849.6
818.8 798.8
Generic dispensing rate (1) :
Total
82.2 %
80.5 % 78.2 %
Mail choice (2)
74.6 %
72.6 % 68.9 %
Pharmacy network (3)
83.0 %
81.3 % 79.1 %
Mail choice penetration rate
21.4 %
22.6 % 22.7 %
(1) Pharmacy network net revenues, claims processed and generic dispensing rates do not include Maintenance Choice, which are
included within the mail choice category.
(2) Mail choice is defined as claims filled at a Pharmacy Services mail facility, which includes specialty mail claims, as well as 90-day
claims filled at our retail stores under the Maintenance Choice program.
(3) Pharmacy network is defined as claims filled at retail pharmacies, including our retail drugstores, but excluding Maintenance
Choice activity.
Net revenues
in our Pharmacy Services Segment increased $12.2 billion, or 16.1%, to approximately $88.4 billion
for the year ended December 31, 2014, as compared to the prior year. The increase in net revenues was primarily
due to growth in specialty pharmacy, including the acquisition of Coram and the impact of Specialty Connect, and
increased pharmacy network volume. Conversely, the increase in our generic dispensing rate had a negative impact
on our revenue in 2014, as it did in 2013.
Net revenues increased $2.8 billion, or 3.8%, to $76.2 billion for the year ended December 31, 2013, as compared to
the prior year. The increase in 2013 was primarily due to drug cost inflation in specialty pharmacy. Additionally, the
increase in our generic dispensing rate had a negative impact on our revenue in 2013, as it did in 2012.