CVS 2014 Annual Report Download - page 16
Download and view the complete annual report
Please find page 16 of the 2014 CVS annual report below. You can navigate through the pages in the report by either clicking on the pages listed below, or by using the keyword search tool below to find specific information within the annual report.-
 1
1 -
2
-
3
-
4
-
5
-
 6
6 -
 7
7 -
 8
8 -
 9
9 -
 10
10 -
 11
11 -
 12
12 -
 13
13 -
 14
14 -
 15
15 -
 16
16 -
 17
17 -
 18
18 -
 19
19 -
 20
20 -
 21
21 -
 22
22 -
 23
23 -
 24
24 -
 25
25 -
 26
26 -
27
-
28
-
29
-
30
-
31
-
32
-
33
-
34
-
35
-
36
-
37
-
38
-
39
-
40
-
41
-
42
-
43
-
44
-
45
-
46
-
47
-
48
-
49
-
50
-
51
-
52
-
53
-
54
-
55
-
56
-
57
-
58
-
59
-
60
-
61
-
62
-
63
-
64
-
65
-
66
-
67
-
68
-
69
-
70
-
71
-
72
-
73
-
74
-
75
-
76
-
77
-
78
-
79
-
80
-
81
-
82
-
83
-
84
-
85
-
86
-
87
-
88
-
89
-
90
-
91
-
92
-
93
-
94
 |
 |

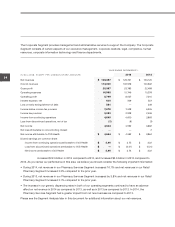
Net revenues $ 139,367 $ 126,761 9.9%
Operating profit $ 8,799 $ 8,037 9.5%
Net income $ 4,644 $ 4,592 1.1%
Diluted EPS from continuing operations $ 3.96 $ 3.75 5.5%
Free cash flow
*
$ 6,516 $ 4,399 48.1%
Stock price at year-end $ 96.31 $ 71.57 34.6%
Market capitalization at year-end $ 109,800 $ 84,437 30.0%
* Free cash flow is defined as net cash provided by operating activities less net additions to properties and equipment (i.e., additions to property and equipment
plus proceeds from sale-leaseback transactions).
Financial highlights
(in millions, except per share figures) 2014 2013 % change
Net revenue
in billions of dollars
139.4
126.8
123.1
107.1
95.8
10 11 12 13 14 10 11 12 13 14 10 11 12 13 14
3.96
3.75
3.02
2.59
2.49
Diluted EPS from
continuing operations
in dollars
1.10
0.90
0.65
0.50
0.35
Annual cash dividends
in dollars per common share
14
CVS Health