CVS 2014 Annual Report Download - page 31
Download and view the complete annual report
Please find page 31 of the 2014 CVS annual report below. You can navigate through the pages in the report by either clicking on the pages listed below, or by using the keyword search tool below to find specific information within the annual report.-
 1
1 -
2
-
3
-
4
-
5
-
6
-
7
-
8
-
9
-
10
-
11
-
12
-
13
-
14
-
15
-
16
-
17
-
18
-
19
-
20
-
 21
21 -
 22
22 -
 23
23 -
 24
24 -
 25
25 -
 26
26 -
 27
27 -
 28
28 -
 29
29 -
 30
30 -
 31
31 -
 32
32 -
 33
33 -
 34
34 -
 35
35 -
 36
36 -
 37
37 -
 38
38 -
 39
39 -
 40
40 -
 41
41 -
42
-
43
-
44
-
45
-
46
-
47
-
48
-
49
-
50
-
51
-
52
-
53
-
54
-
55
-
56
-
57
-
58
-
59
-
60
-
61
-
62
-
63
-
64
-
65
-
66
-
67
-
68
-
69
-
70
-
71
-
72
-
73
-
74
-
75
-
76
-
77
-
78
-
79
-
80
-
81
-
82
-
83
-
84
-
85
-
86
-
87
-
88
-
89
-
90
-
91
-
92
-
93
-
94
 |
 |

29
2014 Annual Report
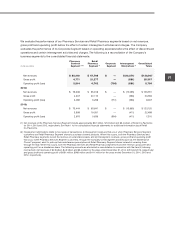
As you review our Pharmacy Services Segment’s revenue performance, we believe you should also consider the
following important information:
• Our mail choice claims processed decreased 1.1% to 82.4 million claims in the year ended December 31, 2014,
compared to 83.3 million claims in the prior year. The decrease in mail choice claims was driven by a decline in
traditional mail volumes, which was mostly offset by growth in our Maintenance Choice program and specialty
pharmacy. During 2013, our mail choice claims processed increased 1.9% to 83.3 million claims. The increase in
mail choice claim volume was primarily due to specialty claim volume and increased claims associated with the
continuing client adoption of our Maintenance Choice offerings.
• During 2014 and 2013, our average revenue per mail choice claim increased by 26.8% and 6.5%, compared to
2013 and 2012, respectively. This increase in 2014 was primarily due to the acquisition of Coram and drug
inflation particularly in specialty pharmacy, partially offset by increases in the percentage of generic prescription
drugs dispensed and changes in client pricing. This increase in 2013 was primarily due to drug inflation particu-
larly in specialty pharmacy, partially offset by increases in the percentage of generic prescription drugs dispensed
and changes in client pricing.
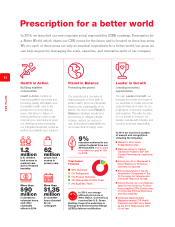
• Our mail choice generic dispensing rate was 74.6%, 72.6% and 68.9% in the years ended December 31, 2014,
2013 and 2012, respectively. Our pharmacy network generic dispensing rate increased to 83.0% in the year ended
December 31, 2014, compared to 81.3% in the prior year. During 2013, our pharmacy network generic dispensing
rate increased to 81.3% compared to our pharmacy network generic dispensing rate of 79.1% in 2012. These
continued increases in mail choice and pharmacy network generic dispensing rates were primarily due to the
impact of new generic drug introductions, primarily in 2012, and our continuous efforts to encourage plan mem-
bers to use generic drugs when they are available. We believe our generic dispensing rates will continue to
increase in future periods, albeit, at a slower pace. This increase will be affected by, among other things, the
number of new generic drug introductions and our success at encouraging plan members to utilize generic drugs
when they are available and clinically appropriate.
• Our pharmacy network claims processed increased 3.8% to 849.6 million claims in the year ended December 31,
2014, compared to 818.8 million claims in the prior year. This increase was primarily due to net new business and
growth in Managed Medicaid, partially offset by a decrease in Medicare Part D claims. Medicare Part D claims
were negatively impacted by the CMS sanctions that were in place during 2013. See “Regulatory and business
changes relating to our participation in Medicare Part D” in Part I, Item 1A, Risk Factors within our Form 10-K for
the year ended December 31, 2014 (“2014 Form 10-K”), for additional information. During 2013, our pharmacy
network claims processed increased 2.5% to 818.8 million compared to 798.8 million pharmacy network claims
processed in 2012. This increase was primarily due to higher claims activity associated with our Medicare Part D
offering.
• Our average revenue per pharmacy network claim processed increased 7.5% in the year ended December 31,
2014 as compared to the prior year. This increase was primarily due to drug inflation and changes in the drug
mix, partially offset by increases in the generic dispensing rate. During 2013, our average revenue per pharmacy
network claim processed decreased by 0.9%, compared to 2012. This decrease was primarily due to increases in
the generic dispensing rate.
• We completed the roll out of Specialty ConnectTM in May 2014, which integrates the Company’s specialty phar-
macy mail and retail capabilities, providing members with the choice to bring their specialty prescriptions to any
CVS/pharmacy® location. Whether submitted through our mail order pharmacy or at CVS/pharmacy, all prescrip-
tions are filled through the Company’s specialty mail order pharmacies, so all revenue from this specialty
prescription services program is recorded within the Pharmacy Services Segment.