CVS 2014 Annual Report Download - page 61
Download and view the complete annual report
Please find page 61 of the 2014 CVS annual report below. You can navigate through the pages in the report by either clicking on the pages listed below, or by using the keyword search tool below to find specific information within the annual report.-
 1
1 -
2
-
3
-
4
-
5
-
6
-
7
-
8
-
9
-
10
-
11
-
12
-
13
-
14
-
15
-
16
-
17
-
18
-
19
-
20
-
21
-
22
-
23
-
24
-
25
-
26
-
27
-
28
-
29
-
30
-
31
-
32
-
33
-
34
-
35
-
36
-
37
-
38
-
39
-
40
-
41
-
42
-
43
-
44
-
45
-
46
-
47
-
48
-
49
-
50
-
 51
51 -
 52
52 -
 53
53 -
 54
54 -
 55
55 -
 56
56 -
 57
57 -
 58
58 -
 59
59 -
 60
60 -
 61
61 -
 62
62 -
 63
63 -
 64
64 -
 65
65 -
 66
66 -
 67
67 -
 68
68 -
 69
69 -
 70
70 -
 71
71 -
72
-
73
-
74
-
75
-
76
-
77
-
78
-
79
-
80
-
81
-
82
-
83
-
84
-
85
-
86
-
87
-
88
-
89
-
90
-
91
-
92
-
93
-
94
 |
 |

59
2014 Annual Report
Short-term and long-term investments — The Company’s short-term investments consist of certificates of
deposit with initial maturities of greater than three months when purchased that mature in less than one year from
the balance sheet date. The Company’s long-term investments of $51 million at December 31, 2014, which are
classified as noncurrent other assets within the accompanying consolidated balance sheet, consist of certificates
of deposit. These investments, which were classified as available-for-sale within Level 1 of the fair value hierarchy,
were carried at fair value, which approximated historical cost at December 31, 2014 and 2013.
Fair value of financial instruments — As of December 31, 2014, the Company’s financial instruments include
cash and cash equivalents, short-term and long-term investments, accounts receivable, accounts payable, contin-
gent consideration liability and short-term debt. Due to the nature of these instruments, the Company’s carrying
value approximates fair value. The carrying amount and estimated fair value of total long-term debt was $12.3 billion
and $13.3 billion, respectively, as of December 31, 2014. The fair value of the Company’s long-term debt was
estimated based on quoted rates currently offered in active markets for the Company’s debt, which is considered
Level 1 of the fair value hierarchy. The Company had outstanding letters of credit, which guaranteed foreign trade
purchases, with a fair value of $4 million as of December 31, 2014. There were no outstanding derivative financial
instruments as of December 31, 2014 and 2013.
Foreign currency translation and transactions — For local currency functional currency, assets and liabilities
are translated at end-of-period rates while revenues and expenses are translated at average rates in effect during
the period. Equity is translated at historical rates and the resulting cumulative translation adjustments are included
as a component of accumulated other comprehensive income (loss).
For U.S. dollar functional currency locations, foreign currency assets and liabilities are remeasured into U.S. dollars
at end-of-period exchange rates, except for non-monetary balance sheet accounts, which are remeasured at
historical exchange rates. Revenue and expense are remeasured at average exchange rates in effect during each
period, except for those expenses related to the nonmonetary balance sheet amounts, which are remeasured at
historical exchange rates. Gains or losses from foreign currency remeasurement are included in income.
Gains and losses arising from foreign currency transactions and the effects of remeasurements were not material
for all periods presented.
Accounts receivable — Accounts receivable are stated net of an allowance for doubtful accounts. The accounts
receivable balance primarily includes amounts due from third party providers (e.g., pharmacy benefit managers,
insurance companies and governmental agencies), clients and members, as well as vendors and manufacturers.
Charges to bad debt are based on both historical write-offs and specifically identified receivables.
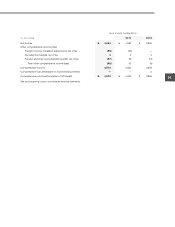
The activity in the allowance for doubtful accounts receivable for the years ended December 31 is as follows:
IN MILLIONS 2014 2013 2012
Beginning balance
$ 256
$ 243 $ 189
Additions charged to bad debt expense
185
195 149
Write-offs charged to allowance
(185)
(182) (95)
Ending balance
$ 256
$ 256 $ 243
Inventories — All inventories are stated at the lower of cost or market. Prescription drug inventories in the RPS and
PSS are accounted for using the weighted average cost method. Front store inventories in the RPS stores are
accounted for on a first-in, first-out basis using the retail inventory method. The RPS front store inventories in the
distribution centers are accounted for using the cost method on a first-in, first-out basis. Physical inventory counts
are taken on a regular basis in each store and a continuous cycle count process is the primary procedure used to