CVS 2011 Annual Report Download - page 82
Download and view the complete annual report
Please find page 82 of the 2011 CVS annual report below. You can navigate through the pages in the report by either clicking on the pages listed below, or by using the keyword search tool below to find specific information within the annual report.-
 1
1 -
2
-
3
-
4
-
5
-
6
-
7
-
8
-
9
-
10
-
11
-
12
-
13
-
14
-
15
-
16
-
17
-
18
-
19
-
20
-
21
-
22
-
23
-
24
-
25
-
26
-
27
-
28
-
29
-
30
-
31
-
32
-
33
-
34
-
35
-
36
-
37
-
38
-
39
-
40
-
41
-
42
-
43
-
44
-
45
-
46
-
47
-
48
-
49
-
50
-
51
-
52
-
53
-
54
-
55
-
56
-
57
-
58
-
59
-
60
-
61
-
62
-
63
-
64
-
65
-
66
-
67
-
68
-
69
-
70
-
71
-
 72
72 -
 73
73 -
 74
74 -
 75
75 -
 76
76 -
 77
77 -
 78
78 -
 79
79 -
 80
80 -
 81
81 -
 82
82 -
 83
83 -
 84
84
 |
 |
CVS CAREMARK 80 2011 ANNUAL REPORT
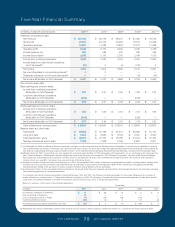
Consolidated Statements of Operations
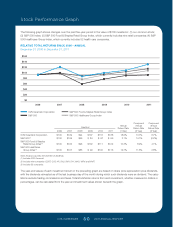
Stock Performance Graph
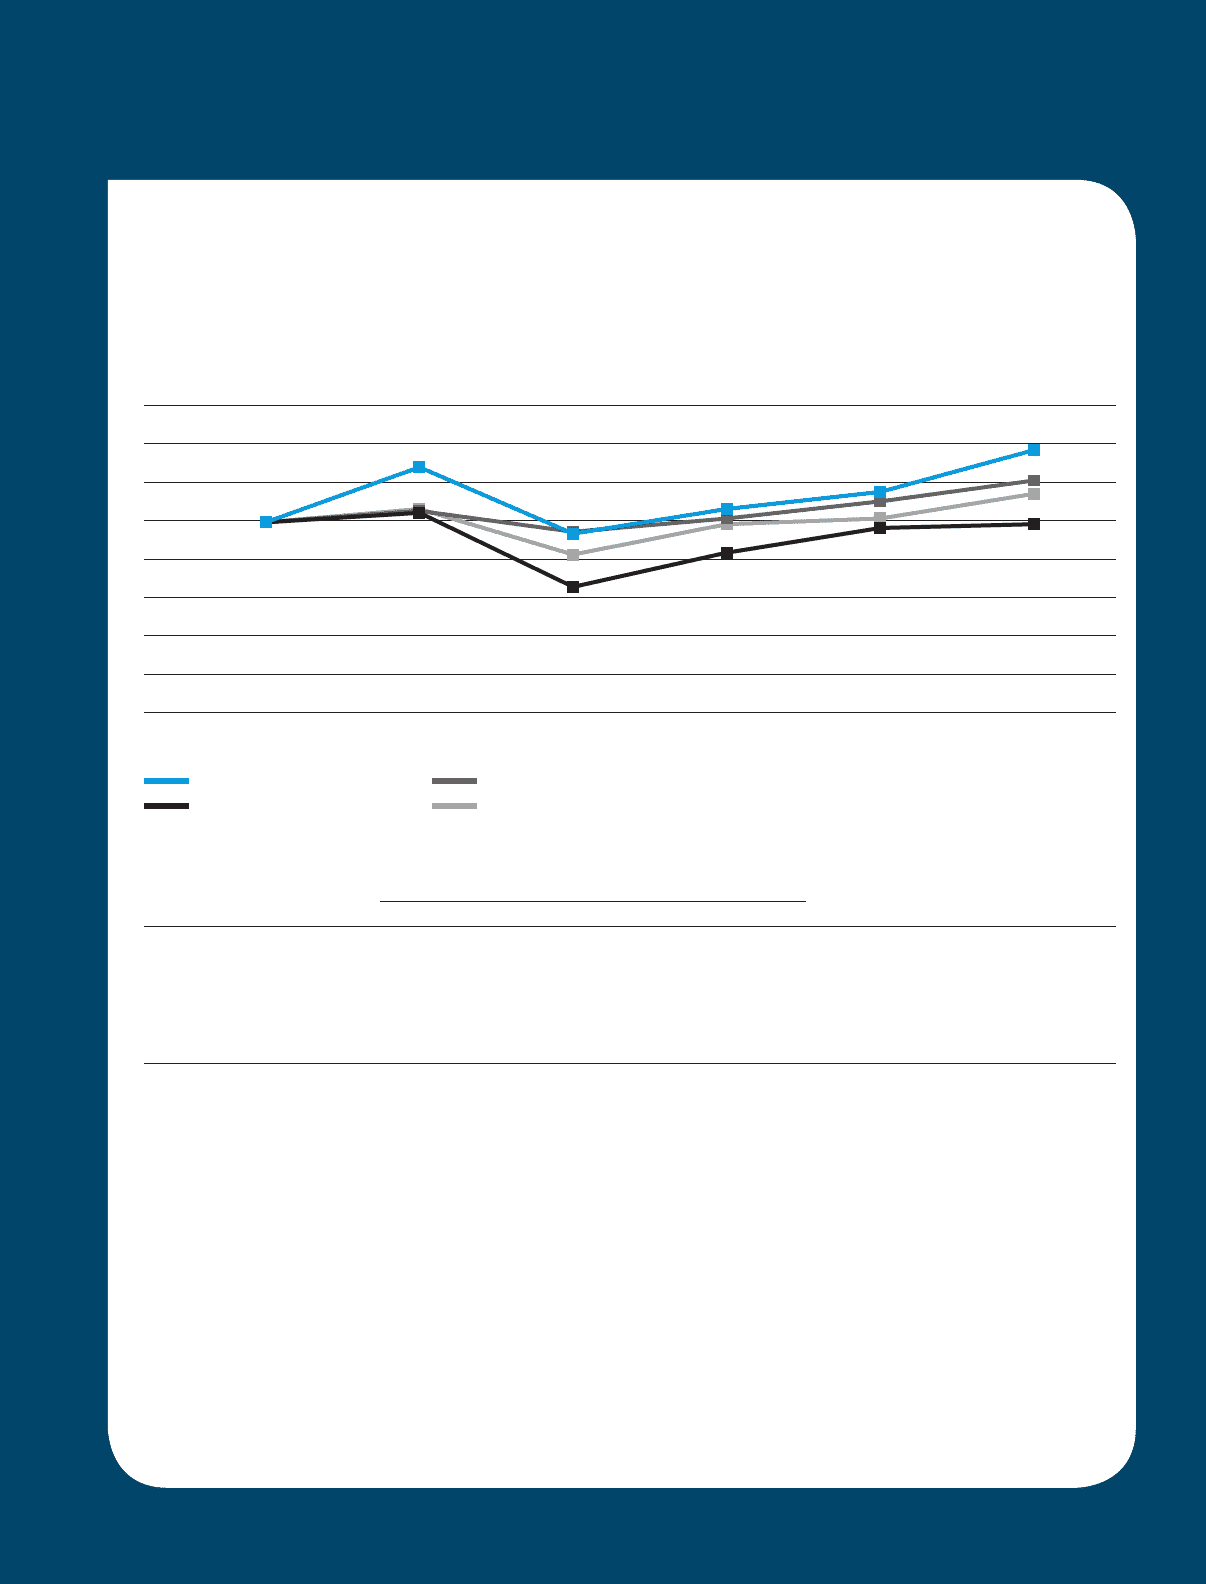
The following graph shows changes over the past five-year period in the value of $100 invested in: (1) our common stock;
(2) S&P 500 Index; (3) S&P 500 Food & Staples Retail Group Index, which currently includes nine retail companies; (4) S&P
500 Healthcare Group Index, which currently includes 52 health care companies.
Compound Compound
Annual Annual Annual
Year End Return Rate Return Rate Return Rate
2006 2007 2008 2009 2010 2011 (1 Year) (3 Year) (5 Year)
CVS Caremark Corporation $100 $129 $94 $107 $116 $138 18.9% 13.7% 6.7%
S&P 500 (1) $100 $105 $66 $084 $097 $099 2.1% 14.1% (0.2%)
S&P 500 Food & Staples
Retail Group Index (2) $100 $106 $95 $102 $111 $122 10.3% 8.9% 4.1%
S&P 500 Healthcare
Group Index (3) $100 $107 $83 $099 $102 $115 12.7% 11.6% 2.8%
Note: Analysis assumes reinvestment of dividends.
(1) Includes CVS Caremark.
(2) Includes nine companies (COST, CVS, KR, SVU, SWY, SYY, WAG, WFM and WMT).
(3) Includes 52 companies.
The year-end values of each investment shown in the preceding graph are based on share price appreciation plus dividends,
with the dividends reinvested as of the last business day of the month during which such dividends were ex-dividend. The calcu-
lations exclude trading commissions and taxes. Total stockholder returns from each investment, whether measured in dollars or
percentages, can be calculated from the year-end investment values shown beneath the graph.
$160
$80
$100
$120
$140
$60
$40
$20
$0
2006 2007 2008 2009 2010 2011
RELATIVE TOTAL RETURNS SINCE 2006 – ANNUAL
December 31, 2006 to December 31, 2011
CVS Caremark Corporation
S&P 500
S&P 500 Food & Staples Retail Group Index
S&P 500 Healthcare Group Index
CVS CAREMARK 80 2011 ANNUAL REPORT
127087_Financial.indd 80 3/12/12 12:23 PM