CVS 2011 Annual Report Download - page 32
Download and view the complete annual report
Please find page 32 of the 2011 CVS annual report below. You can navigate through the pages in the report by either clicking on the pages listed below, or by using the keyword search tool below to find specific information within the annual report.-
 1
1 -
2
-
3
-
4
-
5
-
6
-
7
-
8
-
9
-
10
-
11
-
12
-
13
-
14
-
15
-
16
-
17
-
18
-
19
-
20
-
21
-
 22
22 -
 23
23 -
 24
24 -
 25
25 -
 26
26 -
 27
27 -
 28
28 -
 29
29 -
 30
30 -
 31
31 -
 32
32 -
 33
33 -
 34
34 -
 35
35 -
 36
36 -
 37
37 -
 38
38 -
 39
39 -
 40
40 -
 41
41 -
 42
42 -
43
-
44
-
45
-
46
-
47
-
48
-
49
-
50
-
51
-
52
-
53
-
54
-
55
-
56
-
57
-
58
-
59
-
60
-
61
-
62
-
63
-
64
-
65
-
66
-
67
-
68
-
69
-
70
-
71
-
72
-
73
-
74
-
75
-
76
-
77
-
78
-
79
-
80
-
81
-
82
-
83
-
84
 |
 |

Management’s Discussion and Analysis of Financial Condition
and Results of Operations
CVS CAREMARK 30 2011 ANNUAL REPORT
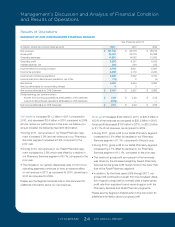
As you review our Pharmacy Services segment’s performance
in this area, we believe you should consider the following
important information:
• Operating expenses increased $105 million to $1.1 bil-
lion, in the year ended December 30, 2011, compared
to $954 million in the prior year. The increase in oper-
ating expenses is primarily related to normal operating
expenses of the acquired UAM Medicare Part D Business,
costs associated with changes designed to streamline our
business, expenses associated with the acquisition and
integration of the UAM Medicare Part D Business, partially
offset by disciplined expense management.
• During 2010, the decrease in operating expenses of $6 mil-
lion or approximately 1.0%, to $954 million compared to
2009, is primarily related to lower bad debt expense, and
lower operating costs associated with our Medicare Part D
program, partially offset by an increase in costs associated
with changes designed to streamline our business.
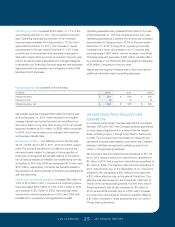
subsidy payments and the drug price to be charged to
enrollees. As discussed previously, these changes have
impacted our ability to offer Medicare Part D plan sponsors
pricing that includes the use of retail network “differential”
or “spread.” This change impacted both our gross profit
dollars and gross profit as a percentage of net revenues in
2011 and 2010 compared to 2009.
Operating expenses in our Pharmacy Services Segment,
which include selling, general and administrative expenses,
depreciation and amortization related to selling, general and
administrative activities and retail specialty pharmacy store
and administrative payroll, employee benefits and occupancy
costs, decreased to 1.8% of net revenues in 2011 compared
to 2.0% and 1.9% in 2010 and 2009, respectively.
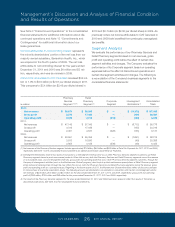
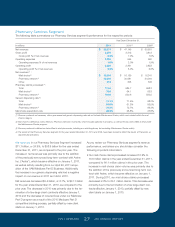
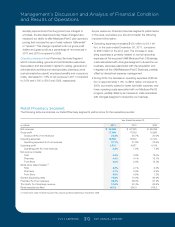
Retail Pharmacy Segment
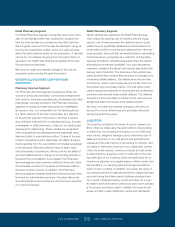
The following table summarizes our Retail Pharmacy segment’s performance for the respective periods:
Year Ended December 31,
in millions 2011 2010 2009
Net revenues $ 59,599 $ 57,345 $ 55,355
Gross profit 17,468 17,039 16,593
Gross profit % of net revenues 29.3% 29.7% 30.0%
Operating expenses 12,556 12,502 12,434
Operating expenses % of net revenues 21.1% 21.8% 22.5%
Operating profit 4,912 4,537 4,159
Operating profit % of net revenues 8.2% 7.9% 7.5%
Net revenue increase:
Total 3.9% 3.6% 13.0%
Pharmacy 4.4% 4.1% 13.1%
Front Store 3.0% 2.6% 12.7%
Same-store sales increase: (1)
Total 2.3% 2.1% 5.0%
Pharmacy 3.1% 2.9% 6.9%
Front Store 0.8% 0.5% 1.2%
Generic dispensing rates 75.6% 73.0% 69.9%
Pharmacy % of net revenues 68.3% 68.0% 67.5%
Third party % of pharmacy revenue 97.8% 97.4% 96.9%
Retail prescriptions filled 657.8 636.3 616.5
(1) Same-store sales increase includes the Longs Drug Stores beginning in November 2009.
127087_Financial.indd 30 3/9/12 9:42 PM