CVS 2011 Annual Report Download - page 28
Download and view the complete annual report
Please find page 28 of the 2011 CVS annual report below. You can navigate through the pages in the report by either clicking on the pages listed below, or by using the keyword search tool below to find specific information within the annual report.-
 1
1 -
2
-
3
-
4
-
5
-
6
-
7
-
8
-
9
-
10
-
11
-
12
-
13
-
14
-
15
-
16
-
17
-
 18
18 -
 19
19 -
 20
20 -
 21
21 -
 22
22 -
 23
23 -
 24
24 -
 25
25 -
 26
26 -
 27
27 -
 28
28 -
 29
29 -
 30
30 -
 31
31 -
 32
32 -
 33
33 -
 34
34 -
 35
35 -
 36
36 -
 37
37 -
 38
38 -
39
-
40
-
41
-
42
-
43
-
44
-
45
-
46
-
47
-
48
-
49
-
50
-
51
-
52
-
53
-
54
-
55
-
56
-
57
-
58
-
59
-
60
-
61
-
62
-
63
-
64
-
65
-
66
-
67
-
68
-
69
-
70
-
71
-
72
-
73
-
74
-
75
-
76
-
77
-
78
-
79
-
80
-
81
-
82
-
83
-
84
 |
 |

Management’s Discussion and Analysis of Financial Condition
and Results of Operations
CVS CAREMARK 26 2011 ANNUAL REPORT
See Note 3 “Discontinued Operations” to the consolidated
financial statements for additional information about dis-
continued operations and Note 13 “Commitments and
Contingencies” for additional information about our
lease guarantees.
Net loss attributable to noncontrolling interest represents
the minority shareholders’ portion of the net loss from our
majority owned subsidiary, Generation Health, Inc., which
we acquired in the fourth quarter of 2009. The net loss
attributable to noncontrolling interest for the years ended
December 31, 2011 and 2010 was $4 million and $3 mil-
lion, respectively, and was de minimis in 2009.
Net income attributable to CVS Caremark increased $34 mil-
lion or 1.0% to $3.5 billion (or $2.57 per diluted share) in 2011.
This compares to $3.4 billion (or $2.49 per diluted share) in
2010 and $3.7 billion (or $2.55 per diluted share) in 2009. As
previously noted, net income attributable to CVS Caremark in
2010 and 2009 both benefited from previously unrecognized
tax benefits.
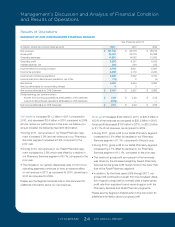
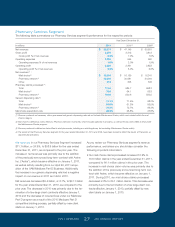
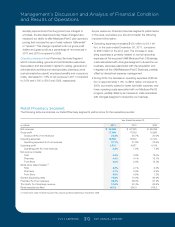
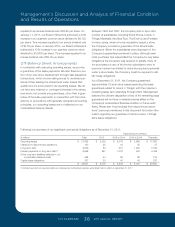
Segment Analysis
We evaluate the performance of our Pharmacy Services and
Retail Pharmacy segments based on net revenues, gross
profit and operating profit before the effect of certain inter-
segment activities and charges. The Company evaluates the
performance of its Corporate segment based on operating
expenses before the effect of discontinued operations and
certain intersegment activities and charges. The following is
a reconciliation of the Company’s business segments to the
consolidated financial statements:
Pharmacy Retail
Services Pharmacy Corporate Intersegment Consolidated
in millions Segment (1)(2)(3) Segment (2) Segment Eliminations (2) Totals
2011:
Net revenues $ 58,874 $ 59,599 $ — $ (11,373) $ 107,100
Gross profit 3,279 17,468 — (186) 20,561
Operating profit 2,220 4,912 (616) (186) 6,330
2010:
Net revenues $ 47,145 $ 57,345 $ — $ (8,712) $ 95,778
Gross profit 3,315 17,039 — (135) 20,219
Operating profit 2,361 4,537 (626) (135) 6,137
2009:
Net revenues $ 50,551 $ 55,355 $ — $ (7,691) $ 98,215
Gross profit 3,813 16,593 — (48) 20,358
Operating profit 2,853 4,159 (539) (48) 6,425
(1) Net revenues of the Pharmacy Services segment include approximately $7.9 billion, $6.6 billion and $6.9 billion of Retail Co-Payments for 2011, 2010 and 2009,
respectively. See Note 1 to the consolidated financial statements for additional information about Retail Co-Payments.
(2) Intersegment eliminations relate to two types of transactions: (i) Intersegment revenues that occur when Pharmacy Services segment customers use Retail
Pharmacy segment stores to purchase covered products. When this occurs, both the Pharmacy Services and Retail Pharmacy segments record the revenue
on a standalone basis, and (ii) Intersegment revenues, gross profit and operating profit that occur when Pharmacy Services segment customers, through the
Company’s intersegment activities (such as the Maintenance Choice® program), elect to pick up their maintenance prescriptions at Retail Pharmacy segment
stores instead of receiving them through the mail. When this occurs, both the Pharmacy Services and Retail Pharmacy segments record the revenue, gross
profit and operating profit on a standalone basis. Beginning in the fourth quarter of 2011, the Maintenance Choice eliminations reflect all discounts available
for the purchase of mail order prescription drugs. The following amounts are eliminated in consolidation in connection with the item (ii) intersegment activity:
net revenues of $2.6 billion, $1.8 billion and $0.7 billion for the years ended December 31, 2011, 2010 and 2009, respectively; gross profit and operating
profit of $186 million, $135 million and $48 million for the years ended December 31, 2011, 2010 and 2009, respectively.
(3) The results of the Pharmacy Services segment for the years ended December 31, 2010 and 2009 have been revised to reflect the results of TheraCom as
discontinued operations. See Note 3 to the consolidated financial statements.
127087_Financial.indd 26 3/9/12 9:42 PM