CVS 2011 Annual Report Download - page 34
Download and view the complete annual report
Please find page 34 of the 2011 CVS annual report below. You can navigate through the pages in the report by either clicking on the pages listed below, or by using the keyword search tool below to find specific information within the annual report.-
 1
1 -
2
-
3
-
4
-
5
-
6
-
7
-
8
-
9
-
10
-
11
-
12
-
13
-
14
-
15
-
16
-
17
-
18
-
19
-
20
-
21
-
22
-
23
-
 24
24 -
 25
25 -
 26
26 -
 27
27 -
 28
28 -
 29
29 -
 30
30 -
 31
31 -
 32
32 -
 33
33 -
 34
34 -
 35
35 -
 36
36 -
 37
37 -
 38
38 -
 39
39 -
 40
40 -
 41
41 -
 42
42 -
 43
43 -
 44
44 -
45
-
46
-
47
-
48
-
49
-
50
-
51
-
52
-
53
-
54
-
55
-
56
-
57
-
58
-
59
-
60
-
61
-
62
-
63
-
64
-
65
-
66
-
67
-
68
-
69
-
70
-
71
-
72
-
73
-
74
-
75
-
76
-
77
-
78
-
79
-
80
-
81
-
82
-
83
-
84
 |
 |

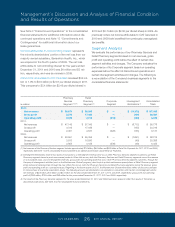
Management’s Discussion and Analysis of Financial Condition
and Results of Operations
CVS CAREMARK 32 2011 ANNUAL REPORT
• The Patient Protection and Affordable Care Act and the
Health Care and Education Reconciliation Act (collectively,
“PPACA”) made several significant changes to Medicaid
rebates and to reimbursement. One of these changes
was to revise the definition of Average Manufacturer Price
and the reimbursement formula for multi-source drugs.
CMS has not yet issued regulations implementing these
changes. Therefore, we cannot predict the effect these
changes will have on Medicaid reimbursement or their
impact on the Company.
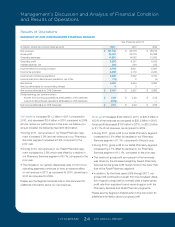
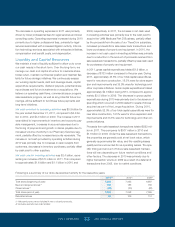
Operating expenses in our Retail Pharmacy Segment include
store payroll, store employee benefits, store occupancy costs,
selling expenses, advertising expenses, depreciation and
amortization expense and certain administrative expenses.
Operating expenses increased $54 million, or less than 1% to
$12.6 billion, or 21.1% as a percentage of net revenues, in the
year ended December 31, 2011, as compared to $12.5 billion,
or 21.8% as a percentage of net revenues, in the prior year.
We continue to see improvement in operating expenses as a
percentage of net revenues for the year ended December 31,
2011, due to improved expense leverage from our same-store
sales growth and expense control initiatives.
Operating expenses increased $68 million, or less than 1%,
to $12.5 billion, or 21.8% as a percentage of net revenues, in
the year ended December 31, 2010, as compared to $12.4 bil-
lion, or 22.5% as a percentage of net revenues, in the
prior year. The increase in operating expenses in 2010 was
the result of higher store operating costs associated with
our increased store count, partially offset by the absence
of costs incurred related to the integration of the Longs
Acquisition which were incurred in 2009. The improvement
in operating expenses as a percentage of net revenues for
the year ended December 31, 2010, was primarily due to
improved expense leverage from our same-store sale growth
and expense control initiatives.
Corporate Segment
Operating expenses decreased $10 million, or 1.6%, to
$616 million in the year ended December 31, 2011, as
compared to the prior year. Operating expenses increased
$87 million, or 16.3% during 2010. Operating expenses
within the Corporate segment include executive man-
agement, corporate relations, legal, compliance, human
resources, corporate information technology and finance
related costs.
As you review our Retail Pharmacy segment’s performance
in this area, we believe you should consider the following
important information:
• On average, our gross profit on front-store revenues is
generally higher than our average gross profit on pharmacy
revenues. Front-store revenues were 31.7%, 32.0% and
32.5% of total revenues, in 2011, 2010 and 2009, respec-
tively. Pharmacy revenues were 68.3%, 68.0% and 67.5%
of total revenues, in 2011, 2010 and 2009, respectively.
This shift in sales mix had a negative effect on our overall
gross profit for the year ended December 31, 2011.
• During 2011 and 2010, our front-store gross profit rate was
positively impacted by increases in private label and pro-
prietary brand product sales, which normally yield a higher
gross profit rate than other front-store products.
• During 2011, 2010 and 2009, our pharmacy gross profit
rate continued to benefit from an increase in generic drug
revenues, which normally yield a higher gross profit rate
than equivalent brand name drug revenues.
• Our pharmacy gross profit rates have been adversely
affected by the efforts of managed care organizations, phar-
macy benefit managers and governmental and other third-
party payors to reduce their prescription drug costs. In the
event this trend continues, we may not be able to sustain
our current rate of revenue growth and gross profit dollars
could be adversely impacted.
• The increased use of generic drugs has positively impacted
our gross profit margins but has resulted in third party pay-
ors augmenting their efforts to reduce reimbursement pay-
ments to retail pharmacies for prescriptions. This trend,
which we expect to continue, reduces the benefit we realize
from brand to generic product conversions.
• Sales to customers covered by third party insurance pro-
grams have continued to increase and, thus, have become
a larger component of our total pharmacy business. On
average, our gross profit on third party pharmacy revenues
is lower than our gross profit on cash pharmacy revenues.
Third party pharmacy revenues were 97.8% of pharmacy
revenues in 2011, compared to 97.4% and 96.9% of phar-
macy revenues in 2010 and 2009, respectively.
• The Federal Government’s Medicare Part D benefit is
increasing prescription utilization. However, it is also
decreasing our pharmacy gross profit rates as our higher
gross profit business (e.g., cash customers) continued to
migrate to Part D coverage during 2011, 2010 and 2009.
127087_Financial.indd 32 3/9/12 9:42 PM