CVS 2011 Annual Report Download - page 31
Download and view the complete annual report
Please find page 31 of the 2011 CVS annual report below. You can navigate through the pages in the report by either clicking on the pages listed below, or by using the keyword search tool below to find specific information within the annual report.-
 1
1 -
2
-
3
-
4
-
5
-
6
-
7
-
8
-
9
-
10
-
11
-
12
-
13
-
14
-
15
-
16
-
17
-
18
-
19
-
20
-
 21
21 -
 22
22 -
 23
23 -
 24
24 -
 25
25 -
 26
26 -
 27
27 -
 28
28 -
 29
29 -
 30
30 -
 31
31 -
 32
32 -
 33
33 -
 34
34 -
 35
35 -
 36
36 -
 37
37 -
 38
38 -
 39
39 -
 40
40 -
 41
41 -
42
-
43
-
44
-
45
-
46
-
47
-
48
-
49
-
50
-
51
-
52
-
53
-
54
-
55
-
56
-
57
-
58
-
59
-
60
-
61
-
62
-
63
-
64
-
65
-
66
-
67
-
68
-
69
-
70
-
71
-
72
-
73
-
74
-
75
-
76
-
77
-
78
-
79
-
80
-
81
-
82
-
83
-
84
 |
 |

CVS CAREMARK 29 2011 ANNUAL REPORT
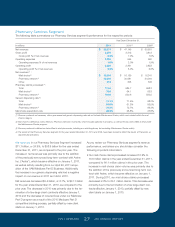
Gross profit in our Pharmacy Services Segment includes net
revenues less cost of revenues. Cost of revenues includes
(i) the cost of pharmaceuticals dispensed, either directly
through our mail service and specialty retail pharmacies or
indirectly through our pharmacy network, (ii) shipping and
handling costs and (iii) the operating costs of our mail service
pharmacies, customer service operations and related infor-
mation technology support.
Gross profit decreased $36 million, or 1.1%, to $3.3 billion
in the year ended December 31, 2011, as compared to the
prior year. Gross profit as a percentage of net revenues was
5.6% for the year ended December 31, 2011, compared to
7.0% in the prior year. The decrease in gross profit dollars in
the year ended December 31, 2011 was primarily driven by
pricing compression relating to contract renewals and in par-
ticular the renewal of a large government client contract that
took effect during the third quarter of 2010 partially offset by
activity associated with our April 2011 acquisition of the UAM
Medicare Part D Business.
During the year ended December 31, 2011, the decrease
in gross profit as a percentage of net revenues was also
driven by the previously mentioned client pricing compres-
sion, as well as the profitability associated with our previously
announced long-term contract with Aetna, which became
effective on January 1, 2011. Additionally, gross profit as
a percentage of net revenue continues to be positively
impacted by the above mentioned increases in our generic
dispensing rates as compared to the prior year.
During 2010, gross profit decreased $498 million, or 13.1%,
to $3.3 billion for the year ended December 31, 2010, as
compared to the prior year. Gross profit as a percentage of net
revenues was 7.0% for the year ended December 31, 2010,
compared to 7.5% in the prior year. The decrease in our gross
profit dollars is a result of the loss of “differential” or “spread”
resulting from a change in CMS regulations described more
fully below, the termination of a few large client contracts
effective January 1, 2010 and the decrease of covered lives
under our Medicare Part D program, partially offset by new
client starts on January 1, 2010. The decrease in gross profit
as a percentage of net revenues is primarily due to the loss of
“differential” or “spread”, pricing compression related to a large
client renewal that took effect during the third quarter of 2010,
and the change in the revenue recognition method from net to
gross associated with the RxAmerica pharmacy network con-
tracts on April 1, 2009 and a large health plan on March 1,
2009. This was partially offset by an increase in our generic
dispensing rate for the year ended December 31, 2010, as
compared to the prior year.
As you review our Pharmacy Services segment’s perfor-
mance in this area, we believe you should consider the
following important information:
• Our gross profit dollars and gross profit as a percentage of
net revenues continued to be impacted by our efforts to (i)
retain existing clients, (ii) obtain new business and (iii) main-
tain or improve the purchase discounts we received from
manufacturers, wholesalers and retail pharmacies. In par-
ticular, competitive pressures in the PBM industry has
caused us and other PBMs to continue to share a larger
portion of rebates and/or discounts received from pharma-
ceutical manufacturers. In addition, market dynamics and
regulatory changes have impacted our ability to offer plan
sponsors pricing that includes retail network “differential”
or “spread”. We expect these trends to continue.
• As discussed previously in this document, we review our
network contracts on an individual basis to determine if
the related revenues should be accounted for using the
gross method or net method under the applicable account-
ing rules. Caremark’s network contracts are predominantly
accounted for using the gross method, which results in
higher revenues, higher cost of revenues and lower gross
profit rates. The conversion of certain RxAmerica contracts
to the Caremark contract structure increased our net rev-
enues, increased our cost of revenues and lowered our
gross profit rates in 2010 and 2009. Although this change
did not affect our gross profit dollars, it did reduce our
gross profit rates by approximately 40 basis points in each
of the years ended December 31, 2010 and 2009.
• Our gross profit as a percentage of revenues benefited
from the increase in our total generic dispensing rate,
which increased to 74.1% and 71.5% in 2011 and 2010,
respectively, compared to our generic dispensing rate of
68.2% in 2009. These increases were primarily due to new
generic drug introductions and our continued efforts to
encourage plan members to use generic drugs when they
are available.
• Effective January 1, 2010, CMS issued a regulation requir-
ing that any difference between the drug price charged to
Medicare Part D plan sponsors by a PBM and the price
paid for the drug by the PBM to the dispensing provider
(commonly called “differential” or “spread”) be reported as
an administrative cost rather than a drug cost of the plan
sponsor for purposes of calculating certain government
127087_Financial.indd 29 3/9/12 9:42 PM