CVS 2011 Annual Report Download - page 27
Download and view the complete annual report
Please find page 27 of the 2011 CVS annual report below. You can navigate through the pages in the report by either clicking on the pages listed below, or by using the keyword search tool below to find specific information within the annual report.-
 1
1 -
2
-
3
-
4
-
5
-
6
-
7
-
8
-
9
-
10
-
11
-
12
-
13
-
14
-
15
-
16
-
 17
17 -
 18
18 -
 19
19 -
 20
20 -
 21
21 -
 22
22 -
 23
23 -
 24
24 -
 25
25 -
 26
26 -
 27
27 -
 28
28 -
 29
29 -
 30
30 -
 31
31 -
 32
32 -
 33
33 -
 34
34 -
 35
35 -
 36
36 -
 37
37 -
38
-
39
-
40
-
41
-
42
-
43
-
44
-
45
-
46
-
47
-
48
-
49
-
50
-
51
-
52
-
53
-
54
-
55
-
56
-
57
-
58
-
59
-
60
-
61
-
62
-
63
-
64
-
65
-
66
-
67
-
68
-
69
-
70
-
71
-
72
-
73
-
74
-
75
-
76
-
77
-
78
-
79
-
80
-
81
-
82
-
83
-
84
 |
 |

CVS CAREMARK 25 2011 ANNUAL REPORT
Operating expenses also increased $149 million in the year
ended December 31, 2010 as compared to the prior year.
Operating expenses as a percent of net revenues increased
approximately 50 basis points to 14.7% in the year ended
December 31, 2010. During 2010, operating expenses
increased as a result of increases in our Corporate seg-
ment expenses of $87 million, and an increase in our Retail
Pharmacy segment expenses of $68 million, partially offset
by a decrease in our Pharmacy Services segment expenses
of $6 million, compared to the prior year.
Please see the Segment Analysis later in this document for
additional information about operating expenses.
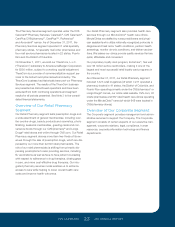
Income (loss) from Discontinued
Operations
In connection with certain business dispositions completed
between 1991 and 1997, the Company retained guarantees
on store lease obligations for a number of former subsid-
iaries, including Linens ‘n Things which filed for bankruptcy
in 2008. The Company’s income (loss) from discontinued
operations includes lease-related costs which the Company
believes it will likely be required to satisfy pursuant to its
Linens ‘n Things lease guarantees.
We incurred a loss from discontinued operations of $31 mil-
lion in 2011 versus income from discontinued operations of
$2 million in 2010 and a loss from discontinued operations of
$4 million in 2009. The loss from discontinued operations in
2011 was primarily due to the disposition of our TheraCom
subsidiary. We recognized a $53 million pre-tax gain and
a $37 million after-tax loss on the sale of TheraCom. The
after-tax loss was caused by the income tax treatment of
TheraCom’s nondeductible goodwill. Income from discon-
tinued operations (net of tax) increased by $6 million in
2010 versus 2009 primarily due to a $15 million increase
in income from operations of TheraCom partially offset by
a $5 million increase in costs associated with our Linen’n
Things lease guarantees.
Operating expenses increased $149 million, or 1.1% in the
year ended December 31, 2011, as compared to the prior
year. Operating expenses as a percent of net revenues
improved approximately 140 basis points to 13.3% in the
year ended December 31, 2011. The increase in operat-
ing expenses in the year ended December 31, 2011 was
primarily due to incremental store operating costs associ-
ated with a higher store count as compared to the prior year
period, as well as costs associated with changes designed
to streamline our Pharmacy Services segment and expenses
associated with the acquisition and integration of the UAM
Medicare Part D Business.
Net interest expense increased $48 million during the year
ended December 31, 2011, which resulted from a higher
average interest rate during the period as we shifted from
short-term debt to long-term debt. During 2010, net interest
expense increased by $11 million, to $536 million compared
to 2009, due to an increase in our average debt balances
and average interest rates.
Income tax provision – Our effective income tax rate was
39.3%, 38.9% and 37.3% in 2011, 2010 and 2009, respec-
tively. The annual fluctuations in our effective income tax
rate are primarily related to changes in the recognition of
previously unrecognized tax benefits relating to the expira-
tion of various statutes of limitation and settlements with tax
authorities. In 2010 and 2009 we recognized $47 million and
$167 million, respectively, of income tax benefits related to
the expiration of various statutes of limitation and settlements
with tax authorities.
Income from continuing operations increased $66 million or
1.9% to $3.5 billion in 2011. Income from continuing opera-
tions decreased $278 million or 7.5% to $3.4 billion in 2010
as compared to $3.7 billion in 2009. As previously noted,
income from continuing operations in 2010 and 2009 both
benefited from previously unrecognized tax benefits.
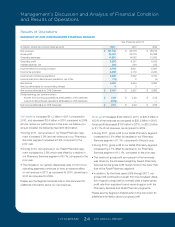
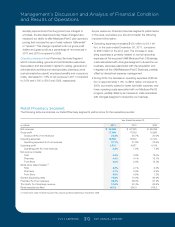
Interest expense, net consisted of the following:
in millions 2011 2010 2009
Interest expense $ 588 $ 539 $ 530
Interest income (4) (3) (5)
Interest expense, net $ 584 $ 536 $ 525
127087_Financial.indd 25 3/9/12 9:42 PM