CVS 2011 Annual Report Download - page 26
Download and view the complete annual report
Please find page 26 of the 2011 CVS annual report below. You can navigate through the pages in the report by either clicking on the pages listed below, or by using the keyword search tool below to find specific information within the annual report.-
 1
1 -
2
-
3
-
4
-
5
-
6
-
7
-
8
-
9
-
10
-
11
-
12
-
13
-
14
-
15
-
 16
16 -
 17
17 -
 18
18 -
 19
19 -
 20
20 -
 21
21 -
 22
22 -
 23
23 -
 24
24 -
 25
25 -
 26
26 -
 27
27 -
 28
28 -
 29
29 -
 30
30 -
 31
31 -
 32
32 -
 33
33 -
 34
34 -
 35
35 -
 36
36 -
37
-
38
-
39
-
40
-
41
-
42
-
43
-
44
-
45
-
46
-
47
-
48
-
49
-
50
-
51
-
52
-
53
-
54
-
55
-
56
-
57
-
58
-
59
-
60
-
61
-
62
-
63
-
64
-
65
-
66
-
67
-
68
-
69
-
70
-
71
-
72
-
73
-
74
-
75
-
76
-
77
-
78
-
79
-
80
-
81
-
82
-
83
-
84
 |
 |

Management’s Discussion and Analysis of Financial Condition
and Results of Operations
CVS CAREMARK 24 2011 ANNUAL REPORT
Gross profit increased $342 million in 2011, to $20.6 billion or
19.2% of net revenues as compared to $20.2 billion in 2010.
Gross profit decreased $139 million in 2010, to $20.2 billion
or 21.1% of net revenues, as compared to 2009.
• During 2011, gross profit in our Retail Pharmacy segment
increased by 2.5% offset by declines in our Pharmacy
Services segment of 1.1%, compared to the prior year.
• During 2010, gross profit in our Retail Pharmacy segment
increased by 2.7% offset by declines in our Pharmacy
Services segment of 13.1%, compared to the prior year.
• The decline in gross profit as a percent of net revenues
was driven by the increased weighting toward Pharmacy
Services whose gross profit margin tends to be lower than
that of the Retail Pharmacy segment.
• In addition, for the three years 2009 through 2011, our
gross profit continued to benefit from the increased utiliza-
tion of generic drugs (which normally yield a higher gross
profit rate than equivalent brand name drugs) in both the
Pharmacy Services and Retail Pharmacy segments.
Please see the Segment Analysis later in this document for
additional information about our gross profit.
Net revenues increased $11.3 billion in 2011 compared to
2010, and decreased $2.4 billion in 2010 compared to 2009.
As you review our performance in this area, we believe you
should consider the following important information:
• During 2011, net revenues in our Retail Pharmacy seg-
ment increased 3.9% and net revenues in our Pharmacy
Services segment increased 24.9% compared to the
prior year.
• During 2010, net revenues in our Retail Pharmacy seg-
ment increased by 3.6% which was offset by a decline in
our Pharmacy Services segment of 6.7%, compared to the
prior year.
• The increase in our generic dispensing rates in both of our
operating segments continues to have an adverse effect
on net revenue in 2011 as compared to 2010, as well as in
2010 as compared to 2009.
Please see the Segment Analysis later in this document for
additional information about our net revenues.
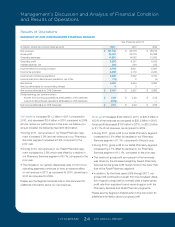
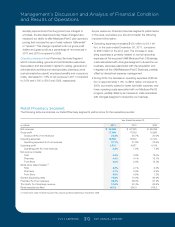
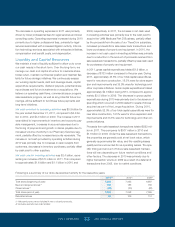
Results of Operations
SUMMARY OF OUR CONSOLIDATED FINANCIAL RESULTS
Year Ended December 31,
in millions, except per common share amounts 2011 2010 2009
Net revenues $ 107,100 $ 95,778 $ 98,215
Gross profit 20,561 20,219 20,358
Operating expenses 14,231 14,082 13,933
Operating profit 6,330 6,137 6,425
Interest expense, net 584 536 525
Income before income tax provision 5,746 5,601 5,900
Income tax provision 2,258 2,179 2,200
Income from continuing operations 3,488 3,422 3,700
Income (loss) from discontinued operations, net of tax (31) 2 (4)
Net income 3,457 3,424 3,696
Net loss attributable to noncontrolling interest 4 3 —
Net income attributable to CVS Caremark $ 3,461 $ 3,427 $ 3,696
Diluted earnings per common share:
Income from continuing operations attributable to CVS Caremark $ 2.59 $ 2.49 $ 2.55
Loss from discontinued operations attributable to CVS Caremark (0.02) — —
Net income attributable to CVS Caremark $ 2.57 $ 2.49 $ 2.55
127087_Financial.indd 24 3/9/12 9:42 PM