CVS 2011 Annual Report Download - page 69
Download and view the complete annual report
Please find page 69 of the 2011 CVS annual report below. You can navigate through the pages in the report by either clicking on the pages listed below, or by using the keyword search tool below to find specific information within the annual report.-
 1
1 -
2
-
3
-
4
-
5
-
6
-
7
-
8
-
9
-
10
-
11
-
12
-
13
-
14
-
15
-
16
-
17
-
18
-
19
-
20
-
21
-
22
-
23
-
24
-
25
-
26
-
27
-
28
-
29
-
30
-
31
-
32
-
33
-
34
-
35
-
36
-
37
-
38
-
39
-
40
-
41
-
42
-
43
-
44
-
45
-
46
-
47
-
48
-
49
-
50
-
51
-
52
-
53
-
54
-
55
-
56
-
57
-
58
-
 59
59 -
 60
60 -
 61
61 -
 62
62 -
 63
63 -
 64
64 -
 65
65 -
 66
66 -
 67
67 -
 68
68 -
 69
69 -
 70
70 -
 71
71 -
 72
72 -
 73
73 -
 74
74 -
 75
75 -
 76
76 -
 77
77 -
 78
78 -
 79
79 -
80
-
81
-
82
-
83
-
84
 |
 |

CVS CAREMARK 67 2011 ANNUAL REPORT
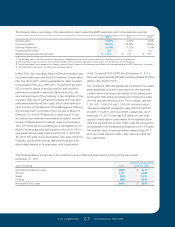
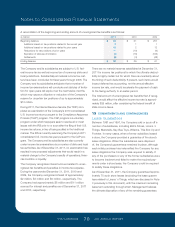
The following table is a summary of the assumptions used to value the ESPP awards for each of the respective periods:
2011 2010 2009
Dividend yield (1) 0.69% 0.57% 0.50%
Expected volatility (2) 20.42% 32.58% 48.89%
Risk-free interest rate (3) 0.15% 0.21% 0.31%
Expected life (in years) (4) 0.5 0.5 0.5
Weighted-average grant date fair value $ 7.21 $ 7.31 $ 8.51
(1) The dividend yield is calculated based on semi-annual dividends paid and the fair market value of the Company’s stock at the grant date.
(2) The expected volatility is based on the historical volatility of the Company’s daily stock market prices over the previous six month period.
(3) The risk-free interest rate is based on the Treasury constant maturity interest rate whose term is consistent with the expected term of ESPP options (i.e., 6 months).
(4) The expected life is based on the semi-annual purchase period.
In May 2010, the Company’s Board of Directors adopted and
the shareholders approved the 2010 Incentive Compensation
Plan (the “2010 ICP”), which superseded the 1997 Incentive
Compensation Plan (the “1997 ICP”). The terms of the 2010
ICP provide for grants of annual incentive and long-term
performance awards to executive officers and other offi-
cers and employees of the Company or any subsidiary of the
Company. Payment of such annual incentive and long-term
performance awards will be in cash, stock, other awards or
other property, at the discretion of the Management Planning
and Development Committee of the Company’s Board of
Directors. The 2010 ICP allows for a maximum of 74 mil-
lion shares to be reserved and available for grants, plus the
number of shares subject to awards under the Company’s
1997 ICP which become available due to cancellation or for-
feiture. Following approval and adoption of the 2010 ICP, no
new grants can be made under the 2007 ICP or 1997 ICP.
The 2010 ICP is the only compensation plan under which the
Company grants stock options, restricted stock and other
stock-based awards to its employees, with the exception
of the Company’s 2007 ESPP. As of December 31, 2011,
there were approximately 58 million shares available for future
grants under the 2010 ICP.
The Company’s restricted awards are considered non-vested
share awards and require no payment from the employee.
Compensation cost is recorded based on the market price
on the grant date and is recognized on a straight-line basis
over the requisite service period. The Company granted
1,121,000, 1,095,000 and 1,284,000 restricted stock
units with a weighted average fair value of $34.84, $35.25
and $27.77 in 2011, 2010 and 2009, respectively. As of
December 31, 2011, there was $39 million of total unrec-
ognized compensation costs related to the restricted stock
units that are expected to vest. These costs are expected to
be recognized over a weighted-average period of 1.94 years.
The total fair value of restricted shares vested during 2011,
2010 and 2009 was $33 million, $44 million and $18 mil-
lion, respectively.
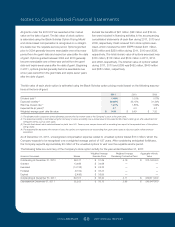
The following table is a summary of the restricted unit and restricted share award activity for the year ended
December 31, 2011:
Weighted Average Grant
units in thousands Units Date Fair Value
Nonvested at beginning of year 2,688 $ 34.16
Granted 1,121 34.84
Vested (969) 35.55
Forfeited (234) 35.00
Nonvested at end of year 2,606 $ 32.80
127087_Financial.indd 67 3/9/12 9:42 PM