CVS 2011 Annual Report Download - page 35
Download and view the complete annual report
Please find page 35 of the 2011 CVS annual report below. You can navigate through the pages in the report by either clicking on the pages listed below, or by using the keyword search tool below to find specific information within the annual report.-
 1
1 -
2
-
3
-
4
-
5
-
6
-
7
-
8
-
9
-
10
-
11
-
12
-
13
-
14
-
15
-
16
-
17
-
18
-
19
-
20
-
21
-
22
-
23
-
24
-
 25
25 -
 26
26 -
 27
27 -
 28
28 -
 29
29 -
 30
30 -
 31
31 -
 32
32 -
 33
33 -
 34
34 -
 35
35 -
 36
36 -
 37
37 -
 38
38 -
 39
39 -
 40
40 -
 41
41 -
 42
42 -
 43
43 -
 44
44 -
 45
45 -
46
-
47
-
48
-
49
-
50
-
51
-
52
-
53
-
54
-
55
-
56
-
57
-
58
-
59
-
60
-
61
-
62
-
63
-
64
-
65
-
66
-
67
-
68
-
69
-
70
-
71
-
72
-
73
-
74
-
75
-
76
-
77
-
78
-
79
-
80
-
81
-
82
-
83
-
84
 |
 |

CVS CAREMARK 33 2011 ANNUAL REPORT
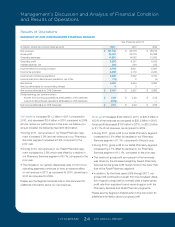
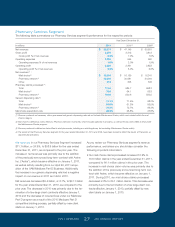
The decrease in operating expenses in 2011 was primarily
driven by lower professional fees for legal services and lower
consulting costs. Operating expenses increased during 2010
primarily due to higher professional fees, primarily for legal
services associated with increased litigation activity, informa-
tion technology services associated with enterprise initiatives,
compensation and benefit costs, and depreciation.
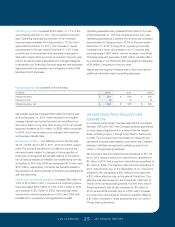
Liquidity and Capital Resources
We maintain a level of liquidity sufficient to allow us to cover
our cash needs in the short-term. Over the long-term, we
manage our cash and capital structure to maximize share-
holder return, maintain our financial position and maintain flex-
ibility for future strategic initiatives. We continuously assess
our working capital needs, debt and leverage levels, capital
expenditure requirements, dividend payouts, potential share
repurchases and future investments or acquisitions. We
believe our operating cash flows, commercial paper program,
sale-leaseback program, as well as any potential future bor-
rowings, will be sufficient to fund these future payments and
long-term initiatives.
Net cash provided by operating activities was $5.9 billion for
the year ended December 31, 2011, compared to $4.8 bil-
lion in 2010, and $4.0 billion in 2009. The increase in 2011
was related to improvements in inventory and accounts pay-
able management, increases in accrued expenses due to
the timing of payments and growth in claims payable due to
increased volume of activity in our Pharmacy Services seg-
ment, partially offset by increased accounts receivable. The
increase in net cash provided by operating activities during
2010 was primarily due to increases in cash receipts from
customers, decreases in inventory purchases, partially offset
by cash paid to other suppliers.
Net cash used in investing activities was $2.4 billion, repre-
senting an increase of $770 million in 2011. This compares
to approximately $1.6 billion and $1.1 billion in 2010 and
2009, respectively. In 2011, the increase in net cash used
in investing activities was primarily due to the cash paid to
acquire the UAM Medicare Part D Business, partially offset
by the proceeds from the sale of our TheraCom subsidiary,
increased proceeds from sale-lease back transactions and
lower purchases of property and equipment. In 2010, the
increase in net cash used in investing activities was primarily
due to a reduction in the amount of proceeds received from
sale-leaseback transactions, partially offset by less cash used
for purchases of property and equipment.
In 2011, gross capital expenditures totaled $1.9 billion, a
decrease of $133 million compared to the prior year. During
2011, approximately 45.8% of our total capital expenditures
were for new store construction, 18.3% were for store expan-
sion and improvements and 35.9% were for technology and
other corporate initiatives. Gross capital expenditures totaled
approximately $2.0 billion during 2010, compared to approxi-
mately $2.5 billion in 2009. The decrease in gross capital
expenditures during 2010 was primarily due to the absence of
spending which occurred in 2009 related to resets of stores
acquired as part of the Longs Acquisition. During 2010,
approximately 52.0% of our total capital expenditures were for
new store construction, 14.5% were for store expansion and
improvements and 33.5% were for technology and other cor-
porate initiatives.
Proceeds from sale-leaseback transactions totaled $592 mil-
lion in 2011. This compares to $507 million in 2010 and
$1.6 billion in 2009. Under the sale-leaseback transactions,
the properties are generally sold at net book value, which
generally approximates fair value, and the resulting leases
qualify and are accounted for as operating leases. The spe-
cific timing and amount of future sale-leaseback transac-
tions will vary depending on future market conditions and
other factors. The decrease in 2010 was primarily due to
higher transaction volume in 2009 as a result of a deferral of
transactions from 2008, due to market conditions.
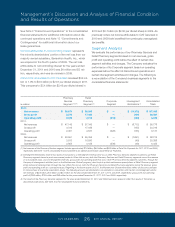
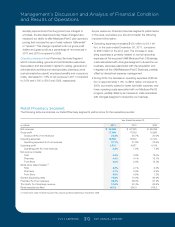
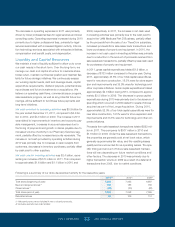
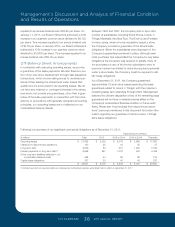
Following is a summary of our store development activity for the respective years:
2011(2) 2010
(2) 2009
(2)
Total stores (beginning of year) 7,248 7,095 6,997
New and acquired stores (1) 162 183 180
Closed stores (1) (22) (30) (82)
Total stores (end of year) 7,388 7,248 7,095
Relocated stores 86 106 110
(1) Relocated stores are not included in new or closed store totals.
(2) Excludes specialty mail order facilities.
127087_Financial.indd 33 3/9/12 9:42 PM