CVS 2011 Annual Report Download - page 60
Download and view the complete annual report
Please find page 60 of the 2011 CVS annual report below. You can navigate through the pages in the report by either clicking on the pages listed below, or by using the keyword search tool below to find specific information within the annual report.-
 1
1 -
2
-
3
-
4
-
5
-
6
-
7
-
8
-
9
-
10
-
11
-
12
-
13
-
14
-
15
-
16
-
17
-
18
-
19
-
20
-
21
-
22
-
23
-
24
-
25
-
26
-
27
-
28
-
29
-
30
-
31
-
32
-
33
-
34
-
35
-
36
-
37
-
38
-
39
-
40
-
41
-
42
-
43
-
44
-
45
-
46
-
47
-
48
-
49
-
 50
50 -
 51
51 -
 52
52 -
 53
53 -
 54
54 -
 55
55 -
 56
56 -
 57
57 -
 58
58 -
 59
59 -
 60
60 -
 61
61 -
 62
62 -
 63
63 -
 64
64 -
 65
65 -
 66
66 -
 67
67 -
 68
68 -
 69
69 -
 70
70 -
71
-
72
-
73
-
74
-
75
-
76
-
77
-
78
-
79
-
80
-
81
-
82
-
83
-
84
 |
 |

Notes to Consolidated Financial Statements
CVS CAREMARK 58 2011 ANNUAL REPORT
than the average market price of the common shares and,
therefore, the effect would be antidilutive.
New Accounting Pronouncements
In January 2010, the Financial Accounting Standards Board
(“FASB”) issued Accounting Standards Update (“ASU”)
2010-06, Fair Value Measurements and Disclosures:
Improving Disclosures about Fair Value Measurements,
(“ASU 2010-06”). ASU 2010-06 expanded the required dis-
closures about fair value measurements by requiring (i) sepa-
rate disclosure of the amounts of significant transfers in and
out of Level 1 and Level 2 fair value measurements along
with the reasons for such transfers, (ii) information about pur-
chases, sales, issuances and settlements to be presented
separately in the reconciliation for Level 3 fair value measure-
ments, (iii) expanded fair value measurement disclosures for
each class of assets and liabilities, and (iv) disclosures about
the valuation techniques and inputs used to measure fair
value for both recurring and nonrecurring fair value measure-
ments that fall in either Level 2 or Level 3. ASU 2010-06
was effective for annual reporting periods beginning after
December 15, 2009, except for (ii) above which is effective for
fiscal years beginning after December 15, 2010. The adop-
tion of ASU 2010-06 did not have a material impact on the
Company’s financial statement disclosures.
In May 2011, the FASB issued ASU 2011-05, Presentation
of Comprehensive Income (“ASU 2011-05”). ASU 2011-05
eliminates the current option to report other comprehen-
sive income and its components in the statement of share-
holders’ equity. Instead, an entity will have the option to
present the total of comprehensive income, the compo-
nents of net income, and the components of other compre-
hensive income either in a single continuous statement of
comprehensive income or in two separate but consecutive
statements. ASU 2011-05 also required entities to present
reclassification adjustments out of accumulated other com-
prehensive income by component in both the statement in
which net income is presented and the statement in which
other comprehensive is presented. In December 2011, the
FASB issued ASU 2011-12 Deferral of the Effective Date
for Amendments to the Presentation of Reclassification of
Items Out of Accumulated Other Comprehensive Income in
Accounting Standards Update No. 2011-05, which indefi-
nitely defers the guidance related to the presentation of
reclassification adjustments. ASU 2011-05 is effective for
interim and annual periods beginning after December 15,
2011 and should be applied retrospectively. The Company
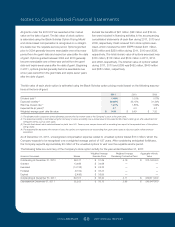
Accumulated other comprehensive loss – Accumulated
other comprehensive loss consists of changes in the net
actuarial gains and losses associated with pension and
other postretirement benefit plans, and unrealized losses
on derivatives. The amount included in accumulated other
comprehensive loss related to the Company’s pension and
postretirement plans was $250 million pre-tax ($152 million
after-tax) as of December 31, 2011 and $217 million pre-tax
($132 million after-tax) as of December 31, 2010. The net
impact on cash flow hedges totaled $32 million pre-tax
($20 million after-tax) and $18 million pre-tax ($11 million
after-tax) as of December 31, 2011 and 2010, respectively.
Stock-based compensation – Stock-based compensa-
tion expense is measured at the grant date based on the fair
value of the award and is recognized as expense over the
applicable requisite service period of the stock award (gener-
ally 3 to 5 years) using the straight-line method. Stock-based
compensation costs are included in selling, general and
administrative expenses.
Income taxes – The Company provides for federal and state
income taxes currently payable, as well as for those deferred
because of timing differences between reported income and
expenses for financial statement purposes versus tax pur-
poses. Federal and state tax credits are recorded as a reduc-
tion of income taxes. Deferred tax assets and liabilities are
recognized for the future tax consequences attributable to
differences between the carrying amount of assets and liabili-
ties for financial reporting purposes and the amounts used
for income tax purposes. Deferred tax assets and liabilities
are measured using the enacted tax rates expected to apply
to taxable income in the years in which those temporary
differences are expected to be recoverable or settled. The
effect of a change in tax rates is recognized as income or
expense in the period of the change.
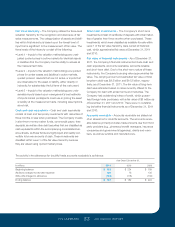
Earnings per common share – Basic earnings per com-
mon share is computed by dividing: (i) net earnings by (ii) the
weighted average number of common shares outstanding
during the year (the “Basic Shares”).
Diluted earnings per common share is computed by dividing:
(i) net earnings by (ii) Basic Shares plus the additional shares
that would be issued assuming that all dilutive stock awards
are exercised. Options to purchase 30.5 million, 34.3 million
and 37.7 million shares of common stock were outstand-
ing as of December 31, 2011, 2010 and 2009, respectively,
but were not included in the calculation of diluted earnings
per share because the options’ exercise prices were greater
127087_Financial.indd 58 3/9/12 9:42 PM