CVS 2011 Annual Report Download - page 29
Download and view the complete annual report
Please find page 29 of the 2011 CVS annual report below. You can navigate through the pages in the report by either clicking on the pages listed below, or by using the keyword search tool below to find specific information within the annual report.-
 1
1 -
2
-
3
-
4
-
5
-
6
-
7
-
8
-
9
-
10
-
11
-
12
-
13
-
14
-
15
-
16
-
17
-
18
-
 19
19 -
 20
20 -
 21
21 -
 22
22 -
 23
23 -
 24
24 -
 25
25 -
 26
26 -
 27
27 -
 28
28 -
 29
29 -
 30
30 -
 31
31 -
 32
32 -
 33
33 -
 34
34 -
 35
35 -
 36
36 -
 37
37 -
 38
38 -
 39
39 -
40
-
41
-
42
-
43
-
44
-
45
-
46
-
47
-
48
-
49
-
50
-
51
-
52
-
53
-
54
-
55
-
56
-
57
-
58
-
59
-
60
-
61
-
62
-
63
-
64
-
65
-
66
-
67
-
68
-
69
-
70
-
71
-
72
-
73
-
74
-
75
-
76
-
77
-
78
-
79
-
80
-
81
-
82
-
83
-
84
 |
 |

CVS CAREMARK 27 2011 ANNUAL REPORT
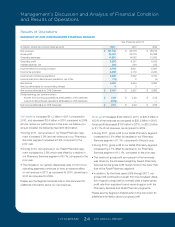
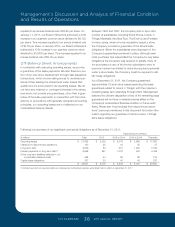
As you review our Pharmacy Services segment’s revenue
performance, we believe you should also consider the
following important information:
• Our mail choice claims processed increased 10.2% to
70.6 million claims in the year ended December 31, 2011,
compared to 64.1 million claims in the prior year. The
increase in mail choice claim volume was primarily due to
the addition of the previously announced long-term con-
tract with Aetna, which became effective on January 1,
2011. During 2010, our mail choice claims processed
decreased 2.6% to 64.1 million claims. This decrease was
primarily due to the termination of a few large client con-
tracts effective January 1, 2010, partially offset by new
client starts on January 1, 2010.
Net revenues in our Pharmacy Services Segment increased
$11.7 billion, or 24.9%, to $58.9 billion for the year ended
December 31, 2011, as compared to the prior year. The
increase in net revenues was primarily due to the addition
of the previously announced long-term contract with Aetna
Inc. (“Aetna”), which became effective on January 1, 2011,
as well as activity resulting from our April 29, 2011 acqui-
sition of the UAM Medicare Part D Business. Additionally,
the increase in our generic dispensing rate had a negative
impact on our revenue in 2011 as it did in 2010.
Net revenues decreased $3.4 billion, or 6.7%, to $47.1 billion
for the year ended December 31, 2010, as compared to the
prior year. The decrease in 2010 was primarily due to the ter-
mination of a few large client contracts effective January 1,
2010 and the decrease of covered lives under our Medicare
Part D program as a result of the 2010 Medicare Part D
competitive bidding process, partially offset by new client
starts on January 1, 2010.
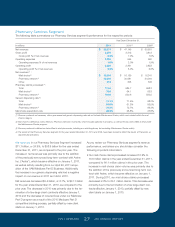
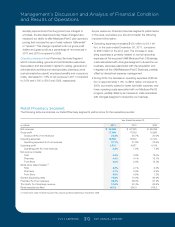
Pharmacy Services Segment
The following table summarizes our Pharmacy Services segment’s performance for the respective periods:
Year Ended December 31,
in millions 2011 2010 (4) 2009
(4)
Net revenues $ 58,874 $ 47,145 $ 50,551
Gross profit 3,279 3,315 3,813
Gross profit % of net revenues 5.6% 7.0% 7.5%
Operating expenses 1,059 954 960
Operating expenses % of net revenues 1.8% 2.0% 1.9%
Operating profit 2,220 2,361 2,853
Operating profit % of net revenues 3.8% 5.0% 5.6%
Net revenues (1) :
Mail choice (2) $ 18,616 $ 16,159 $ 16,241
Pharmacy network (3) 40,040 30,681 34,004
Other 218 305 306
Pharmacy claims processed (1):
Total 774.6 584.7 658.3
Mail choice (2) 70.6 64.1 65.8
Pharmacy network (3) 704.0 520.6 592.5
Generic dispensing rate (1):
Total 74.1% 71.5% 68.2%
Mail choice (2) 64.9% 61.3% 56.5%
Pharmacy network (3) 75.0% 72.7% 69.3%
Mail choice penetration rate 22.3% 25.8% 23.8%
(1) Pharmacy network net revenues, claims processed and generic dispensing rates do not include Maintenance Choice, which are included within the mail
choice category.
(2) Mail choice is defined as claims filled at a Pharmacy Services’ mail facility, which includes specialty mail claims, as well as 90-day claims filled at retail under
the Maintenance Choice program.
(3) Pharmacy network is defined as claims filled at retail pharmacies, including our retail drugstores, but excluding Maintenance Choice activity.
(4) The results of the Pharmacy Services segment for the years ended December 31, 2010 and 2009, have been revised to reflect the results of TheraCom as
discontinued operations.
127087_Financial.indd 27 3/9/12 9:42 PM