CVS 2011 Annual Report Download - page 76
Download and view the complete annual report
Please find page 76 of the 2011 CVS annual report below. You can navigate through the pages in the report by either clicking on the pages listed below, or by using the keyword search tool below to find specific information within the annual report.-
 1
1 -
2
-
3
-
4
-
5
-
6
-
7
-
8
-
9
-
10
-
11
-
12
-
13
-
14
-
15
-
16
-
17
-
18
-
19
-
20
-
21
-
22
-
23
-
24
-
25
-
26
-
27
-
28
-
29
-
30
-
31
-
32
-
33
-
34
-
35
-
36
-
37
-
38
-
39
-
40
-
41
-
42
-
43
-
44
-
45
-
46
-
47
-
48
-
49
-
50
-
51
-
52
-
53
-
54
-
55
-
56
-
57
-
58
-
59
-
60
-
61
-
62
-
63
-
64
-
65
-
 66
66 -
 67
67 -
 68
68 -
 69
69 -
 70
70 -
 71
71 -
 72
72 -
 73
73 -
 74
74 -
 75
75 -
 76
76 -
 77
77 -
 78
78 -
 79
79 -
 80
80 -
 81
81 -
 82
82 -
 83
83 -
 84
84
 |
 |

Notes to Consolidated Financial Statements
CVS CAREMARK 74 2011 ANNUAL REPORT
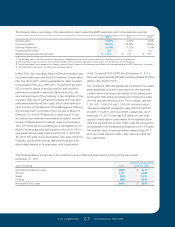
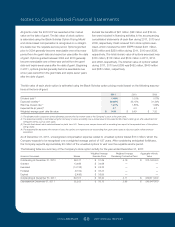
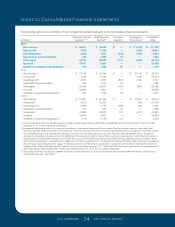
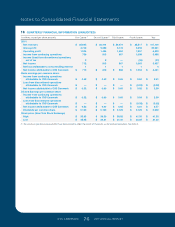
The following table is a reconciliation of the Company’s business segments to the consolidated financial statements:
Pharmacy Services Retail Pharmacy Corporate Intersegment Consolidated
in millions Segment (1) (2) (3) Segment (2) Segment Eliminations (2) Totals
2011:
Net revenues $ 58,874 $ 59,599 $ — $ (11,373) $ 107,100
Gross profit 3,279 17,468 — (186) 20,561
Operating profit 2,220 4,912 (616) (186) 6,330
Depreciation and amortization 433 1,060 75 — 1,568
Total assets 35,704 28,323 1,121 (605) 64,543
Goodwill 19,657 6,801 — — 26,458
Additions to property and equipment 461 1,353 58 — 1,872
2010:
Net revenues $ 47,145 $ 57,345 $ — $ (8,712) $ 95,778
Gross profit 3,315 17,039 — (135) 20,219
Operating profit 2,361 4,537 (626) (135) 6,137
Depreciation and amortization 390 1,016 63 — 1,469
Total assets 32,254 28,927 1,439 (451) 62,169
Goodwill 18,868 6,801 — — 25,669
Additions to property and equipment 234 1,708 63 — 2,005
2009:
Net revenues $ 50,551 $ 55,355 $ — $ (7,691) $ 98,215
Gross profit 3,813 16,593 — (48) 20,358
Operating profit 2,853 4,159 (539) (48) 6,425
Depreciation and amortization 377 965 47 — 1,389
Total assets 33,082 28,302 774 (517) 61,641
Goodwill 18,879 6,801 — — 25,680
Additions to property and equipment 218 2,183 147 — 2,548
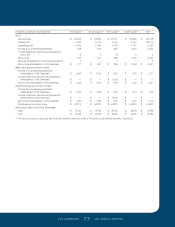
(1) Net revenues of the Pharmacy Services segment include approximately $7.9 billion, $6.6 billion and $6.9 billion of Retail co-payments for the years ended
December 31, 2011, 2010 and 2009, respectively.
(2) Intersegment eliminations relate to two types of transactions: (i) Intersegment revenues that occur when Pharmacy Services segment clients use Retail
Pharmacy segment stores to purchase covered products. When this occurs, both the Pharmacy Services and Retail Pharmacy segments record the revenue
on a standalone basis and (ii) Intersegment revenues, gross profit and operating profit that occur when Pharmacy Services segment clients, through the
Company’s intersegment activities (such as the Maintenance Choice program), elect to pick up their maintenance prescriptions at Retail Pharmacy segment
stores instead of receiving them through the mail. When this occurs, both the Pharmacy Services and Retail Pharmacy segments record the revenue, gross
profit and operating profit on a standalone basis. Beginning in the fourth quarter of 2011, the Maintenance Choice eliminations reflect all discounts available for
the purchase of mail order prescription drugs. The following amounts are eliminated in consolidation in connection with the item (ii) intersegment activity: net
revenues of $2.6 billion, $1.8 billion and $0.7 billion for the years ended December 31, 2011, 2010 and 2009, respectively; gross profit and operating profit of
$186 million, $135 million and $48 million for the years ended December 31, 2011, 2010 and 2009, respectively.
(3) The results of the Pharmacy Services segment for the years ended December 31, 2010 and 2009 have been revised to reflect the results of TheraCom as
discontinued operations. See Note 3.
127087_Financial.indd 74 3/9/12 9:42 PM