CVS 2011 Annual Report Download - page 33
Download and view the complete annual report
Please find page 33 of the 2011 CVS annual report below. You can navigate through the pages in the report by either clicking on the pages listed below, or by using the keyword search tool below to find specific information within the annual report.-
 1
1 -
2
-
3
-
4
-
5
-
6
-
7
-
8
-
9
-
10
-
11
-
12
-
13
-
14
-
15
-
16
-
17
-
18
-
19
-
20
-
21
-
22
-
 23
23 -
 24
24 -
 25
25 -
 26
26 -
 27
27 -
 28
28 -
 29
29 -
 30
30 -
 31
31 -
 32
32 -
 33
33 -
 34
34 -
 35
35 -
 36
36 -
 37
37 -
 38
38 -
 39
39 -
 40
40 -
 41
41 -
 42
42 -
 43
43 -
44
-
45
-
46
-
47
-
48
-
49
-
50
-
51
-
52
-
53
-
54
-
55
-
56
-
57
-
58
-
59
-
60
-
61
-
62
-
63
-
64
-
65
-
66
-
67
-
68
-
69
-
70
-
71
-
72
-
73
-
74
-
75
-
76
-
77
-
78
-
79
-
80
-
81
-
82
-
83
-
84
 |
 |

CVS CAREMARK 31 2011 ANNUAL REPORT
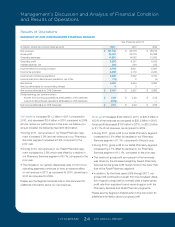
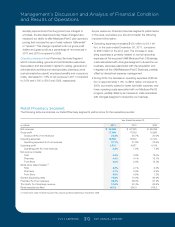
Net revenues increased $2.3 billion, or 3.9%, to $59.6 bil-
lion for the year ended December 31, 2011, as compared
to the prior year. This increase was primarily driven by a
same-store sales increase of 2.3% and net revenues from
new stores, which accounted for approximately 130 basis
points of our total net revenue percentage increase during
the year. Additionally, we continue to see a positive impact
on our net revenues due to the growth of our Maintenance
Choice program.
Net revenues in our Retail Pharmacy Segment increased
$2.0 billion, or 3.6% to $57.3 billion for the year ended
December 31, 2010, as compared to the prior year. This
increase was primarily driven by the same-store sales increase
of 2.1%, and net revenues from new stores, which accounted
for approximately 140 basis points of our total net revenue
percentage increase for the year ended December 31, 2010.
As you review our Retail Pharmacy segment’s performance in
this area, we believe you should consider the following impor-
tant information:
• Pharmacy revenues continued to benefit from incremen-
tal prescription volume associated with our Maintenance
Choice program. Pharmacy same-store sales rose 3.1% in
the year ended December 31, 2011, as compared to the
prior year. The year ended December 31, 2011, includes a
positive impact from Maintenance Choice of approximately
160 basis points on a net basis, (i.e., a positive impact
of approximately 190 basis points on a gross basis, net
of approximately 30 basis points from the conversion of
30-day prescriptions at retail to 90-day prescriptions under
the Maintenance Choice program).
• Pharmacy revenues continue to be negatively impacted
by the conversion of brand name drugs to equivalent
generic drugs, which typically have a lower selling price.
Pharmacy same-store sales were negatively impacted
by approximately 215 basis points for the year ended
December 31, 2011, respectively, due to recent generic
introductions. In addition, our pharmacy growth has also
been adversely affected by the lack of significant new brand
name drug introductions, higher consumer co-payments
and co-insurance arrangements and an increase in the num-
ber of over-the-counter remedies that were historically only
available by prescription.
• As of December 31, 2011, we operated 7,327 retail stores
compared to 7,182 retail stores as of December 31, 2010
and 7,025 retail stores as of December 31, 2009. Total net
revenues from new stores (excluding acquired stores) con-
tributed approximately 1.3%, 1.4% and 1.6% to our total
net revenue percentage increase in 2011, 2010, and 2009,
respectively.
• Pharmacy revenue growth continued to benefit from
increased utilization by Medicare Part D beneficiaries, the
ability to attract and retain managed care customers and
favorable industry trends. These trends include an aging
American population; many “baby boomers” are now in
their fifties and sixties and are consuming a greater num-
ber of prescription drugs. In addition, the increased use
of pharmaceuticals as the first line of defense for individ-
ual health care also contributed to the growing demand
for pharmacy services. We believe these favorable industry
trends will continue.
Gross profit in our Retail Pharmacy Segment includes net rev-
enues less the cost of merchandise sold during the reporting
period and the related purchasing costs, warehousing costs,
delivery costs and actual and estimated inventory losses.
Gross profit increased $429 million, or 2.5%, to $17.5 bil-
lion in the year ended December 31, 2011, as compared to
the prior year. Gross profit as a percentage of net revenues
decreased to 29.3% in year ended December 31, 2011,
from 29.7% in 2010. The increase in gross profit dollars in
the year ended December 31, 2011, was primarily driven
by increases in net revenue. Gross profit as a percentage
of revenue was negatively impacted during 2011 by lower
pharmacy margins due to continued reimbursement pres-
sure which was partially offset by the positive impact of
increased generic drugs dispensed.
Gross profit increased $446 million, or 2.7%, to $17.0 bil-
lion for the year ended December 31, 2010, as compared to
the prior year. Gross profit as a percentage of net revenues
decreased to 29.7% for the year ended December 31, 2010,
compared to 30.0% for the prior year. The decline in gross
profit as a percentage of net revenues was driven by declines
in the gross profit of our pharmacy sales, partially offset by
increases in the gross profit of our front store sales.
127087_Financial.indd 31 3/9/12 9:42 PM