CVS 2011 Annual Report Download - page 55
Download and view the complete annual report
Please find page 55 of the 2011 CVS annual report below. You can navigate through the pages in the report by either clicking on the pages listed below, or by using the keyword search tool below to find specific information within the annual report.-
 1
1 -
2
-
3
-
4
-
5
-
6
-
7
-
8
-
9
-
10
-
11
-
12
-
13
-
14
-
15
-
16
-
17
-
18
-
19
-
20
-
21
-
22
-
23
-
24
-
25
-
26
-
27
-
28
-
29
-
30
-
31
-
32
-
33
-
34
-
35
-
36
-
37
-
38
-
39
-
40
-
41
-
42
-
43
-
44
-
 45
45 -
 46
46 -
 47
47 -
 48
48 -
 49
49 -
 50
50 -
 51
51 -
 52
52 -
 53
53 -
 54
54 -
 55
55 -
 56
56 -
 57
57 -
 58
58 -
 59
59 -
 60
60 -
 61
61 -
 62
62 -
 63
63 -
 64
64 -
 65
65 -
66
-
67
-
68
-
69
-
70
-
71
-
72
-
73
-
74
-
75
-
76
-
77
-
78
-
79
-
80
-
81
-
82
-
83
-
84
 |
 |

Fair Value Hierarchy – The Company utilizes the three-level
valuation hierarchy for the recognition and disclosure of fair
value measurements. The categorization of assets and liabili-
ties within this hierarchy is based upon the lowest level of
input that is significant to the measurement of fair value. The
three levels of the hierarchy consist of the following:
• Level 1 – Inputs to the valuation methodology are unad-
justed quoted prices in active markets for identical assets
or liabilities that the Company has the ability to access at
the measurement date.
• Level 2 – Inputs to the valuation methodology are quoted
prices for similar assets and liabilities in active markets,
quoted prices in markets that are not active or inputs that
are observable for the asset or liability, either directly or
indirectly, for substantially the full term of the instrument.
• Level 3 – Inputs to the valuation methodology are unob-
servable inputs based upon management’s best estimate
of inputs market participants could use in pricing the asset
or liability at the measurement date, including assumptions
about risk.
Cash and cash equivalents – Cash and cash equivalents
consist of cash and temporary investments with maturities of
three months or less when purchased. The Company invests
in short-term money market funds, commercial paper, time
deposits, as well as other debt securities that are classified as
cash equivalents within the accompanying consolidated bal-
ance sheets, as these funds are highly liquid and readily con-
vertible to known amounts of cash. These investments are
classified within Level 1 of the fair value hierarchy because
they are valued using quoted market prices.
Short-term investments – The Company’s short-term
investments consist of certificate of deposits with initial maturi-
ties of greater than three months when purchased. These
investments, which were classified as available-for-sale within
Level 1 of the fair value hierarchy, were carried at historical
cost, which approximated fair value at December 31, 2011
and 2010.
Fair value of financial instruments – As of December 31,
2011, the Company’s financial instruments include cash and
cash equivalents, accounts receivable, accounts payable
and short-term debt. Due to the short-term nature of these
instruments, the Company’s carrying value approximates fair
value. The carrying amount and estimated fair value of total
long-term debt was $9.3 billion and $10.8 billion, respec-
tively, as of December 31, 2011. The fair value of long-term
debt was estimated based on rates currently offered to the
Company for debt with similar terms and maturities. The
Company had outstanding letters of credit, which guaran-
teed foreign trade purchases, with a fair value of $6 million as
of December 31, 2011 and 2010. There were no outstand-
ing derivative financial instruments as of December 31, 2011
and 2010.
Accounts receivable – Accounts receivable are stated net
of an allowance for doubtful accounts. The accounts receiv-
able balance primarily includes trade amounts due from third
party providers (e.g., pharmacy benefit managers, insurance
companies and governmental agencies), clients and mem-
bers, as well as vendors and manufacturers.
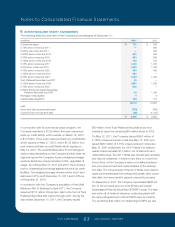
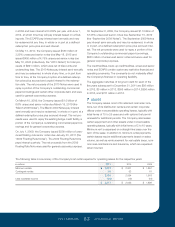
The activity in the allowance for doubtful trade accounts receivable is as follows:
Year Ended December 31,
in millions 2011 2010 2009
Beginning balance $ 182 $ 224 $ 189
Additions charged to bad debt expense 129 73 135
Write-offs charged to allowance (122) (115) (100)
Ending balance $ 189 $ 182 $ 224
CVS CAREMARK 53 2011 ANNUAL REPORT
127087_Financial.indd 53 3/9/12 9:42 PM