CVS 2007 Annual Report Download - page 70
Download and view the complete annual report
Please find page 70 of the 2007 CVS annual report below. You can navigate through the pages in the report by either clicking on the pages listed below, or by using the keyword search tool below to find specific information within the annual report.-
 1
1 -
2
-
3
-
4
-
5
-
6
-
7
-
8
-
9
-
10
-
11
-
12
-
13
-
14
-
15
-
16
-
17
-
18
-
19
-
20
-
21
-
22
-
23
-
24
-
25
-
26
-
27
-
28
-
29
-
30
-
31
-
32
-
33
-
34
-
35
-
36
-
37
-
38
-
39
-
40
-
41
-
42
-
43
-
44
-
45
-
46
-
47
-
48
-
49
-
50
-
51
-
52
-
53
-
54
-
55
-
56
-
57
-
58
-
59
-
 60
60 -
 61
61 -
 62
62 -
 63
63 -
 64
64 -
 65
65 -
 66
66 -
 67
67 -
 68
68 -
 69
69 -
 70
70 -
 71
71 -
 72
72 -
 73
73 -
 74
74 -
 75
75 -
 76
76 -
 77
77 -
 78
78
 |
 |

66 I CVS Caremark
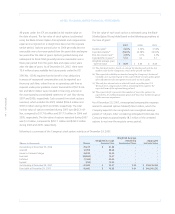
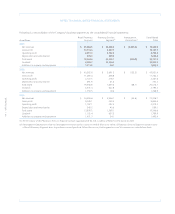
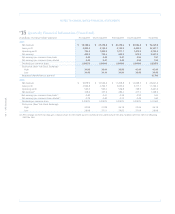
Following is a reconciliation of the Company’s business segments to the consolidated financial statements:
Retail Pharmacy Pharmacy Services Intersegment Consolidated
In millions Segment Segment(1) Eliminations(2) Totals
2007:
Net revenues $ 45,086.5 $ 34,938.4 $ (3,695.4) $ 76,329.5
Gross profit 13,110.6 2,997.1 16,107.7
Operating profit 2,691.3 2,102.0 4,793.3
Depreciation and amortization 805.3 289.3 1,094.6
Total assets 19,962.6 35,015.1 (255.8) 54,721.9
Goodwill 2,585.7 21,336.6 23,922.3
Additions to property and equipment 1,711.2 94.1 1,805.3
2006:
Net revenues $ 40,285.6 $ 3,691.3 $ (155.5) $ 43,821.4
Gross profit 11,283.4 458.8 11,742.2
Operating profit 2,123.5 318.1 2,441.6
Depreciation and amortization 691.9 41.4 733.3
Total assets 19,038.8 1,603.4 (68.1) 20,574.1
Goodwill 2,572.4 622.8 3,195.2
Additions to property and equipment 1,750.5 18.4 1,768.9
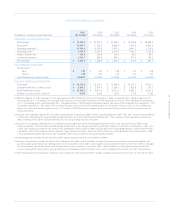
2005:
Net revenues $ 34,094.6 $ 2,956.7 $ (44.6) $ 37,006.7
Gross profit 9,349.1 345.5 9,694.6
Operating profit 1,797.1 222.4 2,019.5
Depreciation and amortization 548.5 40.6 589.1
Total assets 13,878.5 1,368.1 15,246.6
Goodwill 1,152.4 637.5 1,789.9
Additions to property and equipment 1,471.3 24.1 1,495.4
(1) Net Revenues of the Pharmacy Services Segment include approximately $4,618.2 million of Retail Co-Payments in 2007.
(2) Intersegment eliminations relate to intersegment revenues and accounts receivable that occur when a Pharmacy Services Segment customer uses
a Retail Pharmacy Segment store to purchase covered products. When this occurs, both segments record the revenue on a standalone basis.