CVS 2007 Annual Report Download - page 32
Download and view the complete annual report
Please find page 32 of the 2007 CVS annual report below. You can navigate through the pages in the report by either clicking on the pages listed below, or by using the keyword search tool below to find specific information within the annual report.-
 1
1 -
2
-
3
-
4
-
5
-
6
-
7
-
8
-
9
-
10
-
11
-
12
-
13
-
14
-
15
-
16
-
17
-
18
-
19
-
20
-
21
-
 22
22 -
 23
23 -
 24
24 -
 25
25 -
 26
26 -
 27
27 -
 28
28 -
 29
29 -
 30
30 -
 31
31 -
 32
32 -
 33
33 -
 34
34 -
 35
35 -
 36
36 -
 37
37 -
 38
38 -
 39
39 -
 40
40 -
 41
41 -
 42
42 -
43
-
44
-
45
-
46
-
47
-
48
-
49
-
50
-
51
-
52
-
53
-
54
-
55
-
56
-
57
-
58
-
59
-
60
-
61
-
62
-
63
-
64
-
65
-
66
-
67
-
68
-
69
-
70
-
71
-
72
-
73
-
74
-
75
-
76
-
77
-
78
 |
 |

28 I CVS Caremark
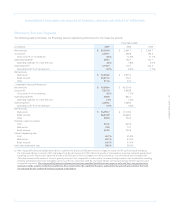
We anticipate that our generic dispensing rates will increase in
future periods which benefits our customers, plan participants
and our financial performance. However, our gross profits
are continually impacted by our ability to profitably retain our
existing customers and win new business, and maintain and
enhance our drug purchase discounts from manufacturers,
wholesalers and retail pharmacies.
• During 2007, on a comparable basis, our gross profit rate was
negatively impacted by the recording of PharmaCare contracts
on a gross basis as previously discussed. The recording of these
revenues on a gross basis did not impact the actual gross profit
amount, however, it did decrease the gross profit margin.
Total operating expenses, which include selling, general
and administrative expenses (including integration and other
related expenses), depreciation and amortization related to
selling, general and administrative activities and retail specialty
pharmacy store and administrative payroll, employee benefits
and occupancy costs decreased to 2.6% of net revenues in 2007,
compared to 3.8% in 2006 and 4.2% in 2005.
As you review our Pharmacy Services Segment’s performance
in this area, we believe you should consider the following
important information:
• During 2007, the Caremark Merger significantly affected our
operating expenses. Total operating expenses for 2007 include
$81.7 million of merger, integration and other related expenses
and $162.6 million of incremental amortization expense resulting
from the preliminary intangible assets recorded in connection
with the Caremark Merger. Please see Note 2 to the consoli-
dated financial statements for additional information.
• During 2007, on a comparable basis, total operating expenses
increased 1.6% to $998.4 million or 2.3% of net revenue,
compared to $982.2 million or 2.4% of net revenue during
2006. 2007 and 2006 comparable results include incremental
depreciation and amortization resulting from the preliminary
fixed and intangible assets recorded in connection with the
Caremark Merger and exclude merger-related expenses and
integration costs.
Liquidity and Capital Resources
We anticipate that our cash flow from operations, supplemented
by commercial paper and long-term borrowings will continue to
fund the future growth of our business.
Net cash provided by operating activities increased to
$3.2 billion in 2007. This compares to $1.7 billion in 2006 and
$1.6 billion in 2005. The increase in net cash provided by opera-
tions during 2007 primarily resulted from increased cash receipts
from revenues due to the Caremark Merger. The increase in
net cash provided by operations during 2006 primarily resulted
from an increase in cash receipts from revenues.
Net cash used in investing activities decreased to
$3.1 billion in 2007. This compares to $4.6 billion in 2006 and
$0.9 billion in 2005. The $3.1 billion of net cash used in investing
activities during 2007 was primarily due to the Caremark Merger.
The increase in net cash used in investing activities during 2006
was primarily due to the acquisition of the Standalone Drug
Business. Gross capital expenditures totaled $1.8 billion during
2007, compared to $1.8 billion in 2006 and $1.5 billion in 2005.
During 2007, approximately 54.6% of our total capital expendi-
tures were for new store construction, 21.7% for store expansion
and improvements and 23.7% for technology and other corporate
initiatives. During 2008, we currently plan to invest over $2.0 bil-
lion in gross capital expenditures, which will include spending for
approximately 300–325 new or relocated stores.
We finance a significant portion of our new store development
program through sale-leaseback transactions. Proceeds from
sale-leaseback transactions totaled $601.3 million in 2007. This
compares to $1.4 billion in 2006, which included approximately
$800 million in proceeds associated with the sale and leaseback
of properties acquired as part of the acquisition of the Standalone
Drug Business, and $539.9 million in 2005. Under the transac-
tions, the properties are sold at net book value and the resulting
leases qualify and are accounted for as operating leases.