CVS 2007 Annual Report Download - page 53
Download and view the complete annual report
Please find page 53 of the 2007 CVS annual report below. You can navigate through the pages in the report by either clicking on the pages listed below, or by using the keyword search tool below to find specific information within the annual report.-
 1
1 -
2
-
3
-
4
-
5
-
6
-
7
-
8
-
9
-
10
-
11
-
12
-
13
-
14
-
15
-
16
-
17
-
18
-
19
-
20
-
21
-
22
-
23
-
24
-
25
-
26
-
27
-
28
-
29
-
30
-
31
-
32
-
33
-
34
-
35
-
36
-
37
-
38
-
39
-
40
-
41
-
42
-
 43
43 -
 44
44 -
 45
45 -
 46
46 -
 47
47 -
 48
48 -
 49
49 -
 50
50 -
 51
51 -
 52
52 -
 53
53 -
 54
54 -
 55
55 -
 56
56 -
 57
57 -
 58
58 -
 59
59 -
 60
60 -
 61
61 -
 62
62 -
 63
63 -
64
-
65
-
66
-
67
-
68
-
69
-
70
-
71
-
72
-
73
-
74
-
75
-
76
-
77
-
78
 |
 |

49 I 2007 Annual Report
Advertising Costs
Advertising costs are expensed when the related advertis-
ing takes place. Advertising costs, net of vendor funding,
(included in operating expenses), were $290.6 million in 2007,
$265.3 million in 2006 and $206.6 million in 2005.
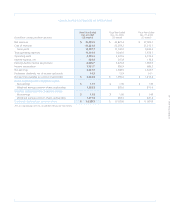
Interest Expense, Net
Interest expense was $468.3 million, $231.7 million and
$117.0 million, and interest income was $33.7 million, $15.9 mil-
lion and $6.5 million in 2007, 2006 and 2005, respectively. Capitalized
interest totaled $23.7 million in 2007, $20.7 million in 2006 and
$12.7 million in 2005.
Accumulated Other Comprehensive Loss
Accumulated other comprehensive loss consists of changes in
the net actuarial gains and losses associated with pension and
other post retirement benefit plans, unrealized losses on deriva-
tives and adjustment to initially apply SFAS No. 158. In accordance
with SFAS No. 158, the amount included in accumulated other
comprehensive income related to the Company’s pension and
post retirement plans was $58.7 million pre-tax ($35.9 million
after-tax) as of December 29, 2007 and $87.4 million pre-tax
($55.4 million after-tax) as of December 30, 2006. The unrealized
loss on derivatives totaled $21.9 million pre-tax ($13.8 million
after-tax) and $27.2 million pre-tax ($17.2 million after-tax) as
of December 29, 2007 and December 30, 2006, respectively.
Stock-Based Compensation
On January 1, 2006, the Company adopted SFAS No. 123(R),
“Share-Based Payment,” using the modified prospective transi-
tion method. Under this method, compensation expense is
recognized for options granted on or after January 1, 2006 as
well as any unvested options on the date of adoption. As allowed
under the modified prospective transition method, prior period
financial statements have not been restated. Prior to January 1,
2006, the Company accounted for its stock-based compensation
plans under the recognition and measurement principles of
Accounting Principles Board (“APB”) Opinion No. 25, “Accounting
for Stock Issued to Employees,” and related interpretations. As
such, no stock-based employee compensation costs were reflected
in net earnings for options granted under those plans since they
had an exercise price equal to the fair market value of the under-
lying common stock on the date of grant. See Note 8 for further
information on stock-based compensation.
Income Taxes
The Company provides for federal and state income taxes
currently payable, as well as for those deferred because of timing
differences between reported income and expenses for financial
statement purposes versus tax purposes. Federal and state tax
credits are recorded as a reduction of income taxes. Deferred tax
assets and liabilities are recognized for the future tax consequences
attributable to differences between the carrying amount of assets
and liabilities for financial reporting purposes and the amounts
used for income tax purposes. Deferred tax assets and liabilities
are measured using the enacted tax rates expected to apply to
taxable income in the years in which those temporary differences
are expected to be recoverable or settled. The effect of a change
in tax rates is recognized as income or expense in the period of
the change. See Note 12 for further information on income taxes.
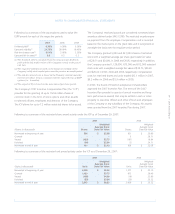
Earnings per Common Share
Basic earnings per common share is computed by dividing: (i) net
earnings, after deducting the after-tax Employee Stock Ownership
Plan (“ESOP”) preference dividends, by (ii) the weighted average
number of common shares outstanding during the year (the
“Basic Shares”).
When computing diluted earnings per common share, the
Company assumes that the ESOP preference stock is converted
into common stock and all dilutive stock awards are exercised.
After the assumed ESOP preference stock conversion, the ESOP
Trust would hold common stock rather than ESOP preference
stock and would receive common stock dividends ($0.22875
per share in 2007, $0.15500 per share in 2006 and $0.14500
per share in 2005) rather than ESOP preference stock dividends
(currently $3.90 per share). Since the ESOP Trust uses the dividends
it receives to service its debt, the Company would have to increase
its contribution to the ESOP Trust to compensate it for the
lower dividends. This additional contribution would reduce
the Company’s net earnings, which in turn, would reduce the
amounts that would be accrued under the Company’s incen-
tive compensation plans.