CVS 2007 Annual Report Download - page 25
Download and view the complete annual report
Please find page 25 of the 2007 CVS annual report below. You can navigate through the pages in the report by either clicking on the pages listed below, or by using the keyword search tool below to find specific information within the annual report.-
 1
1 -
2
-
3
-
4
-
5
-
6
-
7
-
8
-
9
-
10
-
11
-
12
-
13
-
14
-
 15
15 -
 16
16 -
 17
17 -
 18
18 -
 19
19 -
 20
20 -
 21
21 -
 22
22 -
 23
23 -
 24
24 -
 25
25 -
 26
26 -
 27
27 -
 28
28 -
 29
29 -
 30
30 -
 31
31 -
 32
32 -
 33
33 -
 34
34 -
 35
35 -
36
-
37
-
38
-
39
-
40
-
41
-
42
-
43
-
44
-
45
-
46
-
47
-
48
-
49
-
50
-
51
-
52
-
53
-
54
-
55
-
56
-
57
-
58
-
59
-
60
-
61
-
62
-
63
-
64
-
65
-
66
-
67
-
68
-
69
-
70
-
71
-
72
-
73
-
74
-
75
-
76
-
77
-
78
 |
 |

21 I 2007 Annual Report
Income tax provision. Our effective income tax rate was 39.5%
in 2007, 38.5% in 2006 and 35.8% in 2005.
As you review our results in this area, we believe you should
consider the following important information:
• During 2007, our effective income tax rate was negatively
impacted by an increase in interest on income tax reserves and
higher state income taxes principally due to the Caremark
Merger, which resulted in a change in the allocation of income
between states.
• During 2007 and 2006, our effective income tax rate was
negatively impacted by the implementation of SFAS No.123(R)
“Share-Based Payment”, as the compensation expense associ-
ated with our employee stock purchase plan is not deductible
for income tax purposes unless, and until, any disqualifying
dispositions occur.
• During the fourth quarters of 2006 and 2005, the Company
recorded reductions of previously recorded income tax reserves
through the income tax provision of $11.0 million and $52.6
million, respectively.
• For internal comparisons, we find it useful to assess year-to-year
performance by excluding the impact of the reductions of previ-
ously recorded income tax reserves in 2006 and 2005 discussed
above. As such, we consider 39.0% and 38.6% to be the
comparable effective tax rates for 2006 and 2005, respectively.
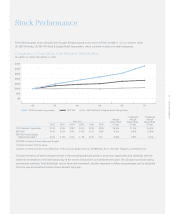
Net earnings increased $1.2 billion or 92.6% to $2.6 billion
(or $1.92 per diluted share) in 2007. This compares to $1.4 billion
(or $1.60 per diluted share) in 2006, and $1.2 billion (or $1.45
per diluted share) in 2005. For internal comparisons, we find
it useful to assess year-to-year performance by excluding the
$40.2 million ($24.7 million after-tax) impact of the SAB 108
Adjustments and $11.0 million reduction of previously recorded
income tax reserves from 2006. As such, we consider $1.3 billion
(or $1.56 per diluted share) to be our comparable net earnings in
2006. In addition, we find it useful to remove the $52.6 million
reduction of previously recorded income tax reserves from 2005.
As such, we consider $1.2 billion (or $1.39 per diluted share) to
be our comparable net earnings in 2005.
Operating expenses increased $2.0 billion and $1.6 billion
during 2007 and 2006, respectively. As you review our perfor-
mance in this area, we believe you should consider the following
important information:
• Total operating expense increased during 2007 primarily due to
the Caremark Merger, which resulted in incremental operating
expenses, depreciation and amortization related to the intan-
gible assets acquired and merger-related integration costs.
• Total operating expenses increased $60.7 million during
2006 due to the adoption of the Statement of Financial
Accounting Standards (“SFAS”) No. 123(R), “Share-Based
Payment.” In addition, total operating expenses increased
during 2006, due to costs incurred to integrate the Standalone
Drug Business.
• During the fourth quarter of 2006, we adopted Staff
Accounting Bulletin No. 108, “Considering the Effects of Prior
Year Misstatements when Quantifying Misstatements in current
Year Financial Statements” (“SAB 108”). In connection with
adopting SAB 108, we recorded adjustments, which collectively
reduced total operating expenses by $40.2 million (the “SAB
108 Adjustments”). Since the effects of the SAB 108 Adjustments
were not material to 2006 or any previously reported fiscal year,
the entire impact was recorded in the fourth quarter of 2006.
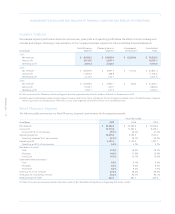
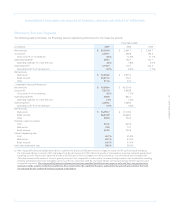
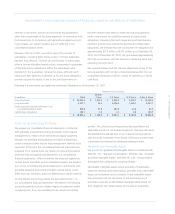
Interest expense, net consisted of the following:
In millions 2007 2006 2005
Interest expense $ 468.3 $ 231.7 $ 117.0
Interest income (33.7) (15.9) (6.5)
Interest expense, net $ 434.6 $ 215.8 $ 110.5
The increase in interest expense during 2007 is due to an
increase in our average debt balance, which resulted primarily
from the borrowings used to fund the special cash dividend paid
to Caremark shareholders and the accelerated share repurchase
program that commenced subsequent to the Caremark Merger.
The increase in interest expense during 2006 was due to a
combination of higher interest rates and higher average debt
balances, which resulted from borrowings used to fund the
acquisition of the Standalone Drug Business.