CVS 2007 Annual Report Download - page 27
Download and view the complete annual report
Please find page 27 of the 2007 CVS annual report below. You can navigate through the pages in the report by either clicking on the pages listed below, or by using the keyword search tool below to find specific information within the annual report.-
 1
1 -
2
-
3
-
4
-
5
-
6
-
7
-
8
-
9
-
10
-
11
-
12
-
13
-
14
-
15
-
16
-
 17
17 -
 18
18 -
 19
19 -
 20
20 -
 21
21 -
 22
22 -
 23
23 -
 24
24 -
 25
25 -
 26
26 -
 27
27 -
 28
28 -
 29
29 -
 30
30 -
 31
31 -
 32
32 -
 33
33 -
 34
34 -
 35
35 -
 36
36 -
 37
37 -
38
-
39
-
40
-
41
-
42
-
43
-
44
-
45
-
46
-
47
-
48
-
49
-
50
-
51
-
52
-
53
-
54
-
55
-
56
-
57
-
58
-
59
-
60
-
61
-
62
-
63
-
64
-
65
-
66
-
67
-
68
-
69
-
70
-
71
-
72
-
73
-
74
-
75
-
76
-
77
-
78
 |
 |

23 I 2007 Annual Report
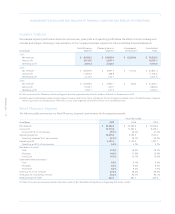
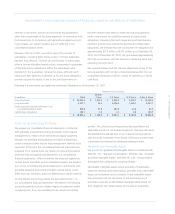
Net revenues. As you review our Retail Pharmacy Segment’s
performance in this area, we believe you should consider the
following important information:
• During 2006, total net revenues were significantly affected
by the acquisition of the Standalone Drug Business on June 2,
2006. Revenues from the Standalone Drug Business increased
total net revenues by approximately 4.9% and 8.7% during 2007
and 2006, respectively.
• During 2005, total net revenues were significantly affected by
the July 31, 2004 acquisition of certain assets and assumption
of certain liabilities from J.C. Penney Company, Inc. and certain
of its subsidiaries, including Eckerd Corporation (“Eckerd”). This
acquisition included more than 1,200 Eckerd retail drugstores
and Eckerd Health Services, which included Eckerd’s mail order
and pharmacy benefit management businesses (collectively, the
“2004 Acquired Businesses”). Revenues from the 2004 Acquired
Businesses increased total net revenues by approximately 11.2%
during 2005. Beginning in August 2005, same store sales include
the acquired Eckerd stores, which increased total same store
sales by approximately 110 basis points during 2006.
• Total net revenues from new stores accounted for approximately
130 basis points of our total net revenue percentage increase in
2007 and 2006 compared to 160 basis points in 2005.
• Total net revenues continued to benefit from our active
relocation program, which moves existing in-line shopping
center stores to larger, more convenient, freestanding locations.
Historically, we have achieved significant improvements in
customer count and net revenue when we do this. As such,
our relocation strategy remains an important component of
our overall growth strategy. As of December 29, 2007, approxi-
mately 64% of our existing stores were freestanding, compared
to approximately 61% and 59% at December 30, 2006 and
December 31, 2005, respectively.
• Pharmacy revenue growth continued to benefit from new
market expansions, increased penetration in existing markets,
the introduction of a prescription drug benefit under Medicare
Part D in 2006, our ability to attract and retain managed care
customers and favorable industry trends. These trends include
an aging American population; many “baby boomers” are now
in their fifties and sixties and are consuming a greater number
of prescription drugs. In addition, the increased use of pharma-
ceuticals as the first line of defense for individual healthcare
also contributed to the growing demand for pharmacy services.
We believe these favorable industry trends will continue.
• Pharmacy revenue dollars continue to be negatively impacted in
all years by the conversion of brand named drugs to equivalent
generic drugs, which typically have a lower selling price. In
addition, our pharmacy growth has also been adversely affected
by the growth of the mail order channel, a decline in the number
of significant new brand named drug introductions, higher
consumer co-payments and co-insurance arrangements and by
an increase in the number of over-the-counter remedies that
were historically only available by prescription. We may choose
not to participate in certain prescription benefit programs that
mandate filling maintenance prescriptions through a mail order
service facility or that implement pharmacy reimbursement rates
that fall below our minimum profitability standards. In the event
we elect to, for any reason, withdraw from current programs
and/or decide not to participate in future programs, we may not
be able to sustain our current rate of sales growth.
Gross profit, which includes net revenues less the cost of
merchandise sold during the reporting period and the related
purchasing costs, warehousing costs, delivery costs and actual
and estimated inventory losses, as a percentage of net revenues
was 29.1% in 2007. This compares to 28.0% in 2006 and 27.4%
in 2005.
As you review our Retail Pharmacy Segment’s performance in
this area, we believe you should consider the following important
information:
• Front store revenues increased as a percentage of total revenues
during 2007. On average our gross profit on front store revenues
is higher than our average gross profit on pharmacy revenues.
Pharmacy revenues as a percentage of total revenues were 67.8%
in 2007, compared to 68.4% in 2006 and 68.6% in 2005.
• Front store gross profit rate benefited from improved product
mix and benefits from our ExtraCare loyalty program.
• Our pharmacy gross profit rate benefited from a portion of the
significant purchasing synergies resulting from the Caremark
Merger. We expect the benefit from purchasing synergies to
continue to positively impact our pharmacy gross profit rate
through fiscal 2008.