CVS 2007 Annual Report Download - page 26
Download and view the complete annual report
Please find page 26 of the 2007 CVS annual report below. You can navigate through the pages in the report by either clicking on the pages listed below, or by using the keyword search tool below to find specific information within the annual report.-
 1
1 -
2
-
3
-
4
-
5
-
6
-
7
-
8
-
9
-
10
-
11
-
12
-
13
-
14
-
15
-
 16
16 -
 17
17 -
 18
18 -
 19
19 -
 20
20 -
 21
21 -
 22
22 -
 23
23 -
 24
24 -
 25
25 -
 26
26 -
 27
27 -
 28
28 -
 29
29 -
 30
30 -
 31
31 -
 32
32 -
 33
33 -
 34
34 -
 35
35 -
 36
36 -
37
-
38
-
39
-
40
-
41
-
42
-
43
-
44
-
45
-
46
-
47
-
48
-
49
-
50
-
51
-
52
-
53
-
54
-
55
-
56
-
57
-
58
-
59
-
60
-
61
-
62
-
63
-
64
-
65
-
66
-
67
-
68
-
69
-
70
-
71
-
72
-
73
-
74
-
75
-
76
-
77
-
78
 |
 |

22 I CVS Caremark
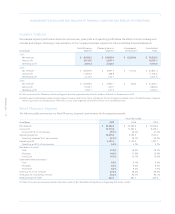
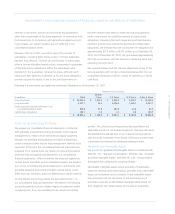
Segment Analysis
We evaluate segment performance based on net revenues, gross profit and operating profit before the effect of certain intersegment
activities and charges. Following is a reconciliation of the Company’s business segments to the consolidated financial statements:
Retail Pharmacy Pharmacy Services Intersegment Consolidated
In millions Segment Segment(1) Eliminations(2) Totals
2007:
Net revenues $ 45,086.5 $ 34,938.4 $ (3,695.4) $ 76,329.5
Gross profit 13,110.6 2,997.1 16,107.7
Operating profit 2,691.3 2,102.0 4,793.3
2006:
Net revenues $ 40,285.6 $ 3,691.3 $ (155.5) $ 43,821.4
Gross profit 11,283.4 458.8 11,742.2
Operating profit 2,123.5 318.1 2,441.6
2005:
Net revenues $ 34,094.6 $ 2,956.7 $ (44.6) $ 37,006.7
Gross profit 9,349.1 345.5 9,694.6
Operating profit 1,797.1 222.4 2,019.5
(1) Net revenues of the Pharmacy Services Segment include approximately $4,618.2 million of Retail Co-Payments for 2007.
(2) Intersegment eliminations relate to intersegment revenues that occur when a Pharmacy Services Segment customer uses a Retail Pharmacy Segment
store to purchase covered products. When this occurs, both segments record the revenue on a standalone basis.
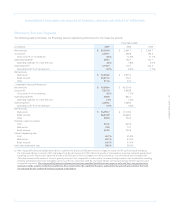
Retail Pharmacy Segment
The following table summarizes our Retail Pharmacy Segment’s performance for the respective periods:
Fiscal Year Ended
In millions 2007 2006 2005
Net revenues $ 45,086.5 $ 40,285.6 $ 34,094.6
Gross profit 13,110.6 11,283.4 9,349.1
Gross profit % of net revenues 29.1% 28.0% 27.4%
Operating expenses 10,419.3 9,159.9 7,552.0
Operating expenses % of net revenues 23.1% 22.7% 22.2%
Operating profit 2,691.3 2,123.5 1,797.1
Operating profit % of net revenues 6.0% 5.3% 5.3%
Net revenue increase:
Total 11.9% 18.2% 18.7%
Pharmacy 10.9% 17.9% 18.8%
Front Store 14.0% 18.7% 18.4%
Same store revenue increase:(1)
Total 5.3% 8.1% 6.3%
Pharmacy 5.2% 9.0% 6.7%
Front Store 5.3% 6.2% 5.5%
Pharmacy % of net revenues 67.8% 68.4% 68.6%
Third party % of pharmacy revenue 95.3% 94.7% 94.1%
Retail prescriptions filled 527.5 481.7 420.6
(1) Same store revenue increase includes the sales results of the Standalone Drug Business beginning July of fiscal 2007.