CVS 2007 Annual Report Download - page 21
Download and view the complete annual report
Please find page 21 of the 2007 CVS annual report below. You can navigate through the pages in the report by either clicking on the pages listed below, or by using the keyword search tool below to find specific information within the annual report.-
 1
1 -
2
-
3
-
4
-
5
-
6
-
7
-
8
-
9
-
10
-
 11
11 -
 12
12 -
 13
13 -
 14
14 -
 15
15 -
 16
16 -
 17
17 -
 18
18 -
 19
19 -
 20
20 -
 21
21 -
 22
22 -
 23
23 -
 24
24 -
 25
25 -
 26
26 -
 27
27 -
 28
28 -
 29
29 -
 30
30 -
 31
31 -
32
-
33
-
34
-
35
-
36
-
37
-
38
-
39
-
40
-
41
-
42
-
43
-
44
-
45
-
46
-
47
-
48
-
49
-
50
-
51
-
52
-
53
-
54
-
55
-
56
-
57
-
58
-
59
-
60
-
61
-
62
-
63
-
64
-
65
-
66
-
67
-
68
-
69
-
70
-
71
-
72
-
73
-
74
-
75
-
76
-
77
-
78
 |
 |
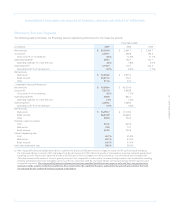
17 I 2007 Annual Report
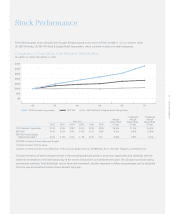
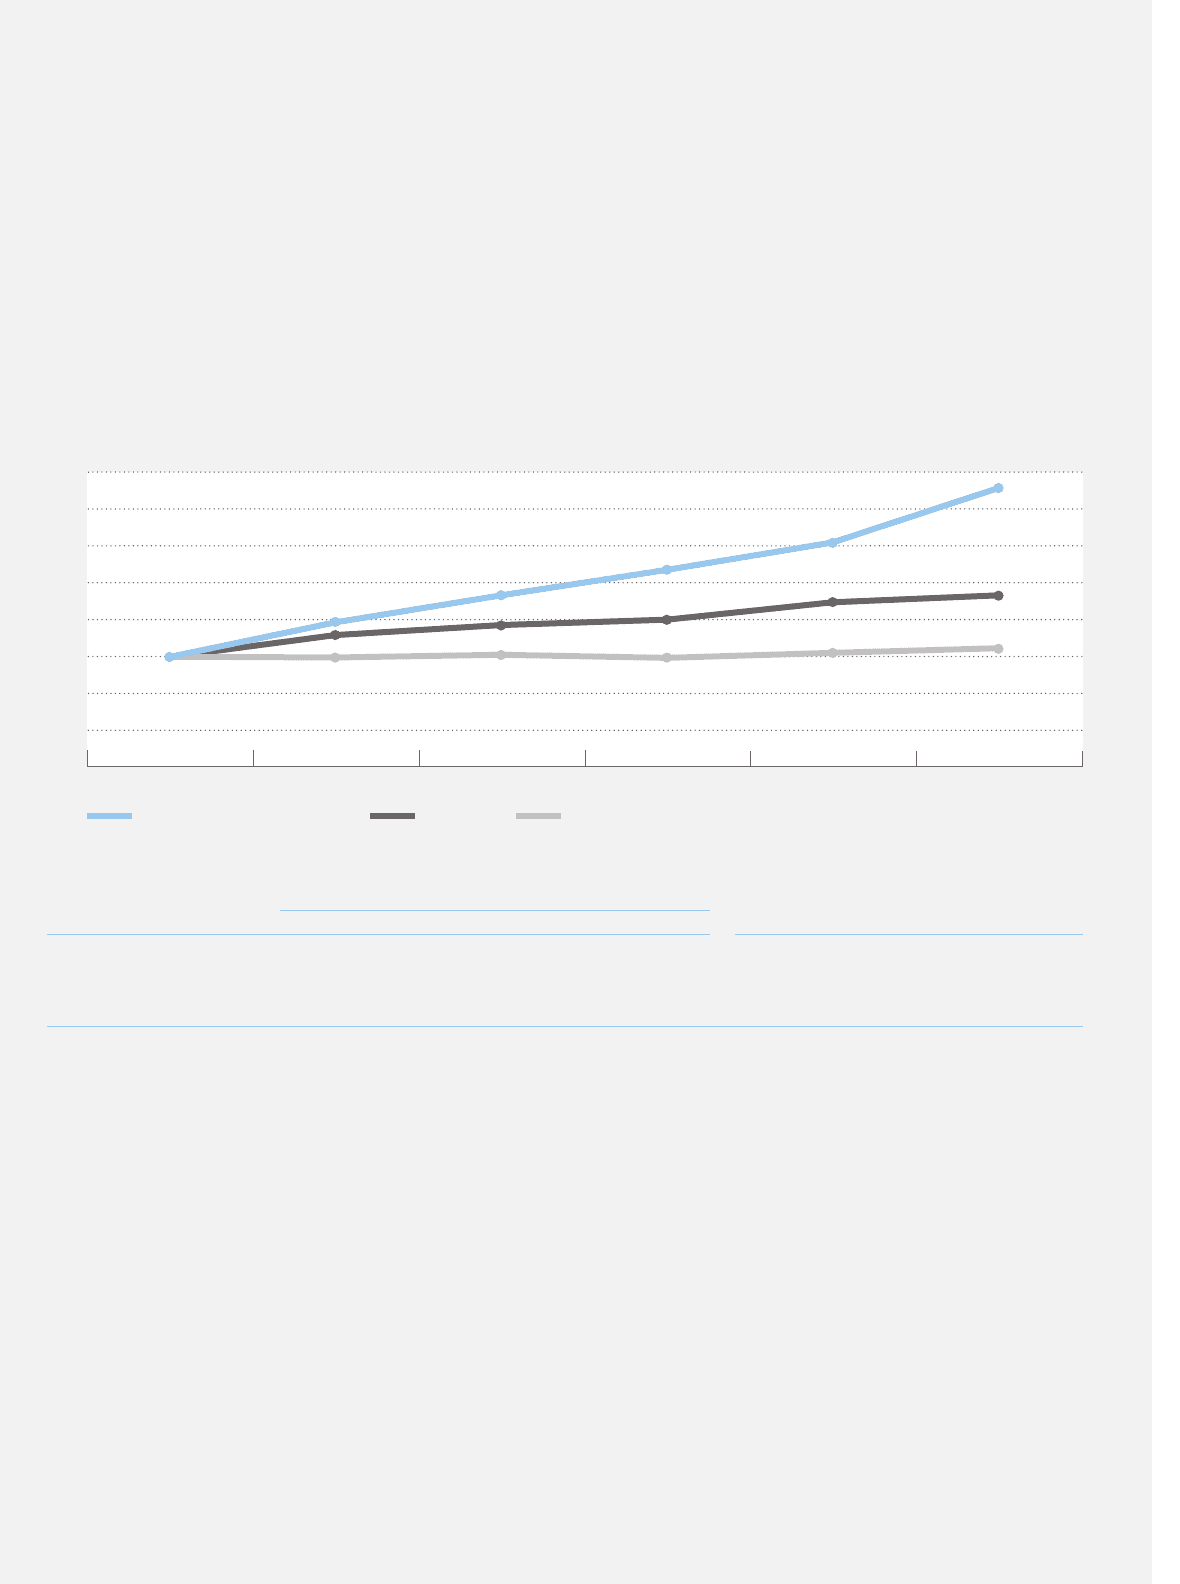
Stock Performance
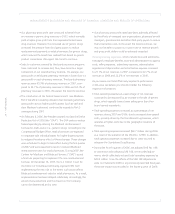
The following graph shows changes over the past five-year period in the value of $100 invested in: (1) our common stock;
(2) S&P 500 Index; (3) S&P 500 Food & Staples Retail Group Index, which currently includes nine retail companies.
Compound Compound
Annual Annual Annual
Year End Return Rate Return Rate Return Rate
2002 2003 2004 2005 2006 2007 (1 Year) (3 Year) (5 Year)
CVS Caremark Corporation $ 100 $ 146 $ 183 $ 216 $ 254 $ 329 29.4% 21.5% 26.9%
S&P 500(1) $ 100 $ 129 $ 143 $ 150 $ 173 $ 183 5.5% 8.6% 12.8%
S&P 500 Food & Staples
Retail Group Index (2) $ 100 $ 99 $ 102 $ 98 $ 105 $ 111 6.0% 2.9% 2.2%
SOURCE: Standard & Poor’s Research Insight
(1) Index includes CVS Caremark
(2) Index currently includes Costco Wholesale, CVS Caremark, Kroger, Safeway, SUPERVALU, Sysco, Wal-Mart, Walgreen, and Whole Foods
$350
$300
$250
$200
$150
$100
$50
$0
0706
03 050402
Comparison of Cumulative Total Return to Shareholders
December 31, 2002 to December 31, 2007
The year-end values of each investment shown in the preceding graph are based on share price appreciation plus dividends, with the
dividends reinvested as of the last business day of the month during which such dividends were paid. The calculations exclude trading
commissions and taxes. Total stockholder returns from each investment, whether measured in dollars or percentages, can be calculated
from the year-end investment values shown beneath the graph.
CVS Caremark Corporation S&P 500 S&P 500 Food & Staples Retail Group Index