CVS 2007 Annual Report Download - page 45
Download and view the complete annual report
Please find page 45 of the 2007 CVS annual report below. You can navigate through the pages in the report by either clicking on the pages listed below, or by using the keyword search tool below to find specific information within the annual report.-
 1
1 -
2
-
3
-
4
-
5
-
6
-
7
-
8
-
9
-
10
-
11
-
12
-
13
-
14
-
15
-
16
-
17
-
18
-
19
-
20
-
21
-
22
-
23
-
24
-
25
-
26
-
27
-
28
-
29
-
30
-
31
-
32
-
33
-
34
-
 35
35 -
 36
36 -
 37
37 -
 38
38 -
 39
39 -
 40
40 -
 41
41 -
 42
42 -
 43
43 -
 44
44 -
 45
45 -
 46
46 -
 47
47 -
 48
48 -
 49
49 -
 50
50 -
 51
51 -
 52
52 -
 53
53 -
 54
54 -
 55
55 -
56
-
57
-
58
-
59
-
60
-
61
-
62
-
63
-
64
-
65
-
66
-
67
-
68
-
69
-
70
-
71
-
72
-
73
-
74
-
75
-
76
-
77
-
78
 |
 |

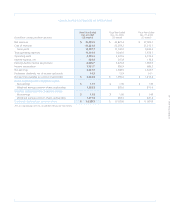
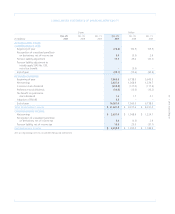
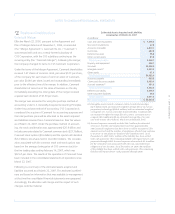
41 I 2007 Annual Report
Fiscal Year Ended Fiscal Year Ended Fiscal Year Ended
Dec. 29, 2007 Dec. 30, 2006 Dec. 31, 2005
In millions (52 weeks) (52 weeks) (52 weeks)
CASH FLOWS FROM OPERATING ACTIVITIES:
Cash receipts from revenues $ 61,986.3 $ 43,273.7 $ 36,923.1
Cash paid for inventory (45,772.6) (31,422.1) (26,403.9)
Cash paid to other suppliers and employees (10,768.6) (9,065.3) (8,186.7)
Interest and dividends received 33.6 15.9 6.5
Interest paid (468.2) (228.1) (135.9)
Income taxes paid (1,780.8) (831.7) (591.0)
Net cash provided by operating activities 3,229.7 1,742.4 1,612.1
CASH FLOWS FROM INVESTING ACTIVITIES:
Additions to property and equipment (1,805.3) (1,768.9) (1,495.4)
Proceeds from sale-leaseback transactions 601.3 1,375.6 539.9
Acquisitions (net of cash acquired) and other
investments (1,983.3) (4,224.2) 12.1
Cash outflow from hedging activities – (5.3) –
Proceeds from sale or disposal of assets 105.6 29.6 31.8
Net cash used in investing activities (3,081.7) (4,593.2) (911.6)
CASH FLOWS FROM FINANCING ACTIVITIES:
Additions to/(reductions in) short-term debt 242.3 1,589.3 (632.2)
Additions to long-term debt 6,000.0 1,500.0 16.5
Reductions in long-term debt (821.8) (310.5) (10.5)
Dividends paid (322.4) (140.9) (131.6)
Proceeds from exercise of stock options 552.4 187.6 178.4
Excess tax benefits from stock based compensation 97.8 42.6 –
Repurchase of common stock (5,370.4) – –
Net cash provided by (used in) financing activities 377.9 2,868.1 (579.4)
Net increase in cash and cash equivalents 525.9 17.3 121.1
Cash and cash equivalents at beginning of year 530.7 513.4 392.3
Cash and cash equivalents at end of year $ 1,056.6 $ 530.7 $ 513.4
RECONCILIATION OF NET EARNINGS TO NET CASH
PROVIDED BY OPERATING ACTIVITIES:
Net earnings $ 2,637.0 $ 1,368.9 $ 1,224.7
Adjustments required to reconcile net earnings to
net cash provided by operating activities:
Depreciation and amortization 1,094.6 733.3 589.1
Stock based compensation 78.0 69.9 –
Deferred income taxes and other non-cash items 40.1 98.2 13.5
Change in operating assets and liabilities providing/
(requiring) cash, net of effects from acquisitions:
Accounts receivable, net 279.7 (540.1) (83.1)
Inventories (448.0) (624.1) (265.2)
Other current assets (59.2) (21.4) (13.2)
Other assets (26.4) (17.2) (0.1)
Accounts payable (181.4) 396.7 192.2
Accrued expenses (168. 2) 328.9 (43.8)
Other long-term liabilities (16.5) (50.7) (2.0)
Net cash provided by operating activities $ 3,229.7 $ 1,742.4 $ 1,612.1
See accompanying notes to consolidated financial statements.