CVS 2007 Annual Report Download - page 30
Download and view the complete annual report
Please find page 30 of the 2007 CVS annual report below. You can navigate through the pages in the report by either clicking on the pages listed below, or by using the keyword search tool below to find specific information within the annual report.-
 1
1 -
2
-
3
-
4
-
5
-
6
-
7
-
8
-
9
-
10
-
11
-
12
-
13
-
14
-
15
-
16
-
17
-
18
-
19
-
 20
20 -
 21
21 -
 22
22 -
 23
23 -
 24
24 -
 25
25 -
 26
26 -
 27
27 -
 28
28 -
 29
29 -
 30
30 -
 31
31 -
 32
32 -
 33
33 -
 34
34 -
 35
35 -
 36
36 -
 37
37 -
 38
38 -
 39
39 -
 40
40 -
41
-
42
-
43
-
44
-
45
-
46
-
47
-
48
-
49
-
50
-
51
-
52
-
53
-
54
-
55
-
56
-
57
-
58
-
59
-
60
-
61
-
62
-
63
-
64
-
65
-
66
-
67
-
68
-
69
-
70
-
71
-
72
-
73
-
74
-
75
-
76
-
77
-
78
 |
 |

26 I CVS Caremark
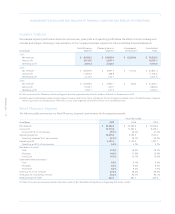
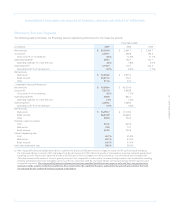
During 2007, the Pharmacy Services Segment’s results of
operations were significantly affected by the Caremark Merger.
As such, the primary focus of our Pharmacy Services Segment
discussion is on the comparable financial information for 2007
and 2006. Prior to the Caremark Merger, our pharmacy services
business did meet the threshold for separate disclosure and the
trends for the pharmacy services business, which was comprised
of our PharmaCare subsidiary, did not differ materially from the
trends for the consolidated Company. Consequently, we do not
believe that a comparison of the historical financial results for
2006 as compared to the 2005 historical financial results provides
meaningful information.
Net revenues. As you review our Pharmacy Services Segment’s
revenue performance, we believe you should consider the
following important information:
• During 2007, the Caremark Merger significantly affected
net revenues. The addition of Caremark’s operations effective
March 22, 2007 caused net revenues to increase approximately
$29.8 billion during 2007.
• The Pharmacy Services Segment recognizes revenues for
its national retail pharmacy network transactions based on
individual contract terms. In accordance with Emerging Issues
Task Force Issue No. 99-19, “Reporting Revenue Gross as a
Principal versus Net as an Agent”, (“EITF 99-19”), Caremark’s
contracts are predominantly accounted for using the gross
method whereas, prior to September 2007, PharmaCare’s
contracts were accounted for using the net method. Effective
September 1, 2007, we converted a number of the PharmaCare
retail pharmacy network contracts to the Caremark contract
structure, which resulted in those contracts being accounted for
using the gross method. As a result, net revenues increased by
approximately $1.0 billion during 2007. Please see Note 1
to the consolidated financial statements for further informa-
tion about the Pharmacy Services Segment’s revenue
recognition policies.
• Changes in mail service and retail network revenue are primarily
impacted by changes in pharmacy claims processed, drug
cost inflation, customer and claims mix, customer pricing and
generic dispensing rates. Increases in generic dispensing rates
have the effect of reducing total net revenues. Our business
model is built around the alignment of our financial interests
with those of our customers and their participants by making
the use of prescription drugs safer and more affordable.
Our clients and their participants benefit from the lower cost
of generic drugs. Our net revenues are reduced as generic
dispensing rates increase, however, our gross profit and
gross profit margins generally increase with the corresponding
increase in generic dispensing rates since generic drug revenues
normally yield a higher gross profit rate than equivalent brand
name drug revenues.
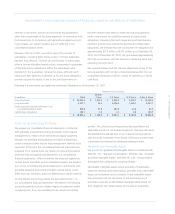
• During 2007, on a comparable basis, mail service claims
processed increased to 73.9 million, or 0.9%. Our average
revenue per mail service claim increased by 7.2%. Average
revenue per mail service claim was impacted primarily by claims
mix, generic dispensing rates and drug inflation. Specialty mail
service claims, which have significantly higher average net
revenues per claim, increased our average revenue per mail
claim by 5.0%. In addition, our average revenue per mail service
claims increased 2.2% primarily due to drug cost inflation offset
by an increase in the percentage of generic drugs dispensed.
Mail service generic dispensing rates increased to 48.1%
in 2007, compared to 43.3% in 2006. The 480 basis point
increase in generic dispensing rate was primarily attributable to
new generic drug introductions during 2007 and 2006 as well
as our continued efforts to encourage plan participants to
utilize generic drugs when available. During 2007, average
revenue per specialty mail service claim increased 18.1%.
The 18.1% increase primarily related to changes in the mix
of specialty drug therapies we dispensed in 2007 from 2006
and drug cost inflation.
• During 2007, on a comparable basis, retail network claims
processed increased to 533.3 million claims compared to
532.6 million in 2006. Average revenue per retail network
claim processed increased by 6.2%. The $1.0 billion change
in revenue recognition for PharmaCare contracts previously
discussed and the impact of the change in revenue recognition
from net to gross for a health plan contract effective in the
second quarter of 2006, increased our average revenue per
retail network claim process by approximately 5.6%. In addition,
our average revenue per retail network claim processed increased
approximately 0.6% primarily due to drug cost inflation offset
by an increase in the percentage of generic drugs dispensed.
Our retail network generic dispensing rate increased to 61.7%