American Airlines 1998 Annual Report Download - page 58
Download and view the complete annual report
Please find page 58 of the 1998 American Airlines annual report below. You can navigate through the pages in the report by either clicking on the pages listed below, or by using the keyword search tool below to find specific information within the annual report.-
 1
1 -
2
-
3
-
4
-
5
-
6
-
7
-
8
-
9
-
10
-
11
-
12
-
13
-
14
-
15
-
16
-
17
-
18
-
19
-
20
-
21
-
22
-
23
-
24
-
25
-
26
-
27
-
28
-
29
-
30
-
31
-
32
-
33
-
34
-
35
-
36
-
37
-
38
-
39
-
40
-
41
-
42
-
43
-
44
-
45
-
46
-
47
-
 48
48 -
 49
49 -
 50
50 -
 51
51 -
 52
52 -
 53
53 -
 54
54 -
 55
55 -
 56
56 -
 57
57 -
 58
58 -
 59
59 -
 60
60 -
 61
61 -
 62
62 -
 63
63 -
 64
64 -
 65
65 -
 66
66
 |
 |

56
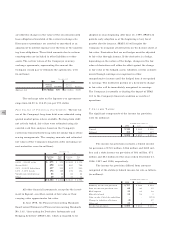
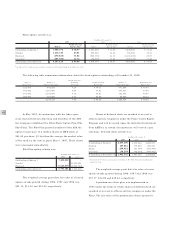
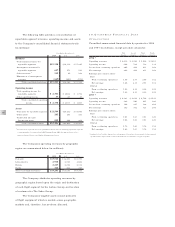
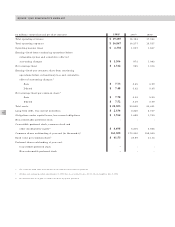
The following table provides a reconciliation of
reportable segment revenues, operating income and assets
to the Company’s consolidated financial statement totals
(in millions):
Year Ended December 31,
1998 1997 1996
Revenues
Total external revenues for
reportable segments $19,128 $18,119 $ 17,295
Intersegment revenues for
reportable segments 627 573 541
Other revenues 1119 95 102
Elimination of intersegment
revenues (669) (603) (574)
Total consolidated revenues $19,205 $18,184 $ 17,364
Operating income
Total operating income for
reportable segments $2,301 $1,882 $ 1,772
Other operating income 37 25 35
Total consolidated operating
income $2,338 $1,907 $ 1,807
Assets
To tal assets for reportable segments
$21,509 $20,212 $ 19,806
Other assets 285 241 241
Unallocated amounts:
Income tax assets 509 406 404
Total consolidated assets $22,303 $20,859 $ 20,451
1Revenues from segments below the quantitative threshold for determining reportable segments
consist primarily of revenues from AMR Training Group, AMR Investment Services, Inc.,
Americas Ground Services and Airline Management Services.
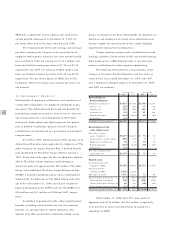
The Company’s operating revenues by geographic
region are summarized below (in millions):
Year Ended December 31,
1998 1997 1996
Domestic $13,546 $12,651 $11,979
Latin America 2,968 2,915 2,884
Europe 2,247 2,214 2,134
Pacific 444 404 367
Total consolidated revenues $19,205 18,184 $17,364
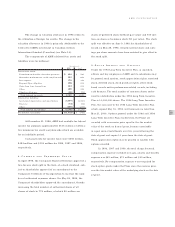
The Company attributes operating revenues by
geographic region based upon the origin and destination
of each flight segment for the Airline Group and location
of customer for The Sabre Group.
The Company’s tangible assets consist primarily
of flight equipment which is mobile across geographic
markets and, therefore, has not been allocated.
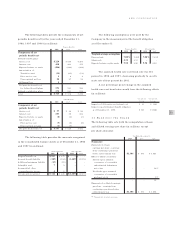
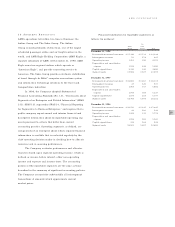
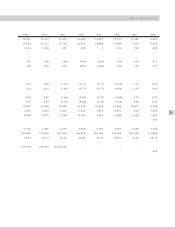
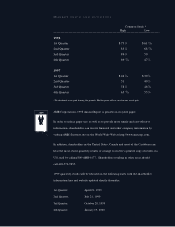
16.QUARTERLY FINANCIAL DATA
(UNAUDITED)
Unaudited summarized financial data by quarter for 1998
and 1997 (in millions, except per share amounts):
First Second Third Fourth
Quarter Quarter Quarter Quarter
1998 *
Operating revenues $ 4,634 $ 4,924 $ 5,046 $ 4,601
Operating income 548 724 732 334
Income from continuing operations
285 408 431 182
Net earnings 290 409 433 182
Earnings per common share:
Basic
From continuing operations 1.65 2.37 2.56 1.12
Net earnings 1.68 2.38 2.57 1.12
Diluted
From continuing operations 1.59 2.29 2.48 1.09
Net earnings 1.62 2.30 2.49 1.09
1997 *
Operating revenues $ 4,323 $ 4,614 $ 4,706 $ 4,541
Operating income 340 580 607 380
Income from continuing operations
146 297 322 208
Net earnings 152 302 323 208
Earnings per common share:
Basic
From continuing operations 0.81 1.63 1.83 1.20
Net earnings 0.84 1.66 1.83 1.20
Diluted
From continuing operations 0.79 1.60 1.78 1.16
Net earnings 0.82 1.63 1.78 1.16
* Results for 1997 and the first and second quarters of 1998 have been restated for discontinued
operations. The impact of the restated amounts was not material to any given quarter.
$13,546
18,184
$19,205 $
$12,651