American Airlines 1998 Annual Report Download - page 55
Download and view the complete annual report
Please find page 55 of the 1998 American Airlines annual report below. You can navigate through the pages in the report by either clicking on the pages listed below, or by using the keyword search tool below to find specific information within the annual report.-
 1
1 -
2
-
3
-
4
-
5
-
6
-
7
-
8
-
9
-
10
-
11
-
12
-
13
-
14
-
15
-
16
-
17
-
18
-
19
-
20
-
21
-
22
-
23
-
24
-
25
-
26
-
27
-
28
-
29
-
30
-
31
-
32
-
33
-
34
-
35
-
36
-
37
-
38
-
39
-
40
-
41
-
42
-
43
-
44
-
 45
45 -
 46
46 -
 47
47 -
 48
48 -
 49
49 -
 50
50 -
 51
51 -
 52
52 -
 53
53 -
 54
54 -
 55
55 -
 56
56 -
 57
57 -
 58
58 -
 59
59 -
 60
60 -
 61
61 -
 62
62 -
 63
63 -
 64
64 -
 65
65 -
66
 |
 |

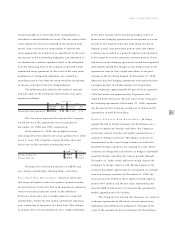
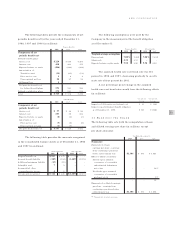
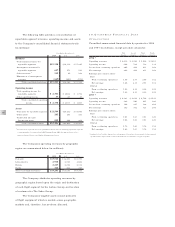
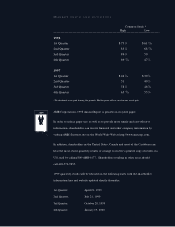
The following assumptions were used by the
Company in the measurement of the benefit obligation
as of December 31:
Pension Benefits Other Benefits
1998 1997 1998 1997
Weighted-average assumptions
Discount rate 7.00% 7.25% 7.00% 7.25%
Salary scale 4.32 4.19 --
Expected return on plan assets 9.50 9.50 9.50 9.50
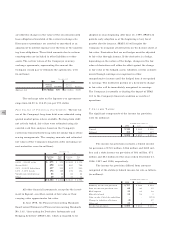
The assumed health care cost trend rate was five
percent in 1998 and 1997, decreasing gradually to an ulti-
mate rate of four percent by 2001.
A one percentage point change in the assumed
health care cost trend rates would have the following effects
(in millions):
One percent One percent
increase decrease
Impact on 1998 service and interest cost $ 23 $ (24)
Impact on postretirement benefit obligation
as of December 31, 1998 $ 141 $ (148)
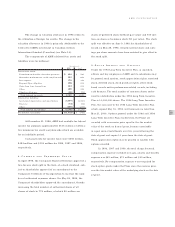
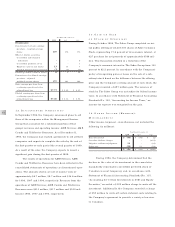
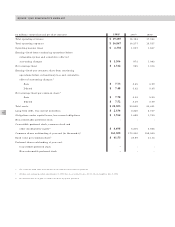
11.EARNINGS PER SHARE
The following table sets forth the computation of basic
and diluted earnings per share (in millions, except
per share amounts):
Year Ended December 31,
1998 1997 1996
Numerator:
Numerator for basic
earnings per share - earnings
from continuing operations
before extraordinary loss $1,306 $973 $ 1,083
Effect of dilutive securities:
Interest upon assumed
conversion of convertible
subordinated debentures,
net of tax - - 14(a)
Dividends upon assumed
conversion of convertible
preferred stock - - 1(a)
- - 15
Numerator for diluted earnings
per share - earnings from
continuing operations before
extraordinary loss $1,306 $973 $ 1,098
(a) Through date of actual conversion
53
AMR CORPORATION
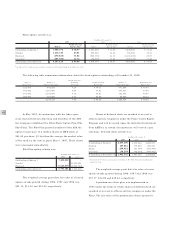
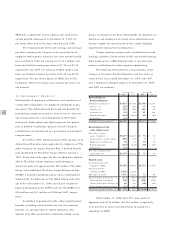
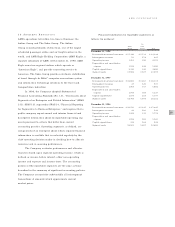
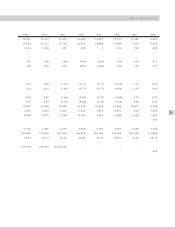
The following tables provide the components of net
periodic benefit cost for the years ended December 31,
1998, 1997 and 1996 (in millions):
Pension Benefits
1998 1997 1996
Components of net
periodic benefit cost
Defined benefit plans:
Service cost $224 $189 $ 204
Interest cost 430 403 375
Expected return on assets (486) (429) (422)
Amortization of:
Transition asset (11) (11) (11)
Prior service cost 44 4
Unrecognized net loss 24 27 16
Settlement loss 6- -
Net periodic benefit cost
for defined benefit plans 191 183 166
Defined contribution plans 174 153 132
Total $365 $336 $ 298
Other Benefits
1998 1997 1996
Components of net
periodic benefit cost
Service cost $57 $48 $ 58
Interest cost 103 95 102
Expected return on assets (6) (4) (3)
Amortization of:
Prior service cost (5) (5) (5)
Unrecognized net gain (2) (9) -
Net periodic benefit cost $147 $125 $ 152
The following table provides the amounts recognized
in the consolidated balance sheets as of December 31, 1998
and 1997 (in millions):
Pension Benefits Other Benefits
1998 1997 1998 1997
Prepaid benefit cost $297 $377 $-$-
Accrued benefit liability (185) (152) (1,649) (1,573)
Additional minimum liability (13) (11) --
Intangible asset 75 --
Accumulated other
comprehensive income 66 --
Net amount recognized $112 $225 $(1,649) $(1,573)