American Airlines 1998 Annual Report Download - page 26
Download and view the complete annual report
Please find page 26 of the 1998 American Airlines annual report below. You can navigate through the pages in the report by either clicking on the pages listed below, or by using the keyword search tool below to find specific information within the annual report.-
 1
1 -
2
-
3
-
4
-
5
-
6
-
7
-
8
-
9
-
10
-
11
-
12
-
13
-
14
-
15
-
 16
16 -
 17
17 -
 18
18 -
 19
19 -
 20
20 -
 21
21 -
 22
22 -
 23
23 -
 24
24 -
 25
25 -
 26
26 -
 27
27 -
 28
28 -
 29
29 -
 30
30 -
 31
31 -
 32
32 -
 33
33 -
 34
34 -
 35
35 -
 36
36 -
37
-
38
-
39
-
40
-
41
-
42
-
43
-
44
-
45
-
46
-
47
-
48
-
49
-
50
-
51
-
52
-
53
-
54
-
55
-
56
-
57
-
58
-
59
-
60
-
61
-
62
-
63
-
64
-
65
-
66
 |
 |

24
AMR Corporation (AMR or the Company) was incor-
porated in October 1982. AMR’s principal subsidiary,
American Airlines, Inc. (American), was founded in 1934.
Following the announcement of AMR’s plans to sell the
companies that comprised the majority of what was previ-
ously the Management Services Group, AMR’s operations
fall within two major lines of business: the Airline Group
and The Sabre Group. Additional segment information is
included in Note 15 to the consolidated financial state-
ments.
RESULTS OF OPERATIONS
AMR’s net earnings in 1998 were $1.3 billion, or $7.78
per common share ($7.52 diluted). These results represent
the strongest net earnings ever reported by AMR for a fis-
cal year. AMR’s net earnings in 1997 were $985 million, or
$5.52 per common share ($5.39 diluted). The Company’s
1997 results were adversely affected by (i) a brief strike
and the strike threat from members of the Allied Pilots
Association (APA) during the first quarter of 1997, which
negatively impacted the Company’s net earnings by an
estimated $70 million, and (ii) the reinstatement of the
airline transportation tax in March of 1997.
The following sections provide a discussion of AMR’s
results by reporting segment. The gain on the sale of stock
by a subsidiary of $497 million in 1996 and minority inter-
est expense of $40 million, $36 million and $2 million in
1998, 1997 and 1996, respectively, have not been allocated
to a reporting segment. Additional segment information is
included in Note 15 to the consolidated financial statements.
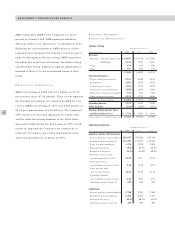
BUSINESS SEGMENT
FINANCIAL HIGHLIGHTS
Airline Group
Year Ended December 31,
(dollars in millions) 1998 1997 1996
Revenues
Passenger - American Airlines, Inc.
$14,695 $14,310 $ 13,645
- AMR Eagle 1,121 1,017 1,047
Cargo 656 687 682
Other 977 889 837
17,449 16,903 16,211
Operating Expenses
Wages, salaries and benefits 5,763 5,480 5,191
Aircraft fuel 1,604 1,923 1,936
Commissions to agents 1,226 1,278 1,252
Depreciation and amortization 1,038 1,038 1,018
Maintenance, materials and repairs
934 861 686
Other operating expenses 4,933 4,754 4,686
Total operating expenses 15,498 15,334 14,769
Operating Income 1,951 1,569 1,442
Other Expense (160) (266) (428)
Earnings Before Income Taxes
and Extraordinary Loss $ 1,791 $1,303 $ 1,014
Average number of equivalent employees
92,000 90,600 88,900
Operating Statistics
Year Ended December 31,
1998 1997 1996
American Airlines Jet Operations
Revenue passenger miles (millions)
108,955 107,026 104,710
Available seat miles (millions) 155,297 153,917 152,886
Cargo ton miles (millions) 1,974 2,032 2,028
Passenger load factor 70.2
%
69.5
%
68.5
%
Breakeven load factor 59.9
%
61.0
%
60.2
%
Passenger revenue yield
per passenger mile (cents) 13.49 13.37 13.03
Passenger revenue
per available seat mile (cents) 9.46 9.30 8.92
Cargo revenue yield
per ton mile (cents) 32.85 33.78 33.14
Operating expenses
per available seat mile (cents) 9.25 9.27 8.91
Operating aircraft at year-end 648 641 642
AMR Eagle
Revenue passenger miles (millions)
2,788 2,553 2,590
Available seat miles (millions) 4,471 4,218 4,431
Passenger load factor 62.4
%
60.5
%
58.5
%
Operating aircraft at year-end 209 199 205
M ANAGEM ENT’ S DISCUSSION AND ANALYSIS