Seagate 2004 Annual Report Download - page 74
Download and view the complete annual report
Please find page 74 of the 2004 Seagate annual report below. You can navigate through the pages in the report by either clicking on the pages listed below, or by using the keyword search tool below to find specific information within the annual report.-
 1
1 -
2
-
3
-
4
-
5
-
6
-
7
-
8
-
9
-
10
-
11
-
12
-
13
-
14
-
15
-
16
-
17
-
18
-
19
-
20
-
21
-
22
-
23
-
24
-
25
-
26
-
27
-
28
-
29
-
30
-
31
-
32
-
33
-
34
-
35
-
36
-
37
-
38
-
39
-
40
-
41
-
42
-
43
-
44
-
45
-
46
-
47
-
48
-
49
-
50
-
51
-
52
-
53
-
54
-
55
-
56
-
57
-
58
-
59
-
60
-
61
-
62
-
63
-
 64
64 -
 65
65 -
 66
66 -
 67
67 -
 68
68 -
 69
69 -
 70
70 -
 71
71 -
 72
72 -
 73
73 -
 74
74 -
 75
75 -
 76
76 -
 77
77 -
 78
78 -
 79
79 -
 80
80 -
 81
81 -
 82
82 -
 83
83 -
 84
84 -
85
-
86
-
87
-
88
-
89
-
90
-
91
-
92
-
93
-
94
-
95
-
96
-
97
-
98
-
99
-
100
-
101
-
102
-
103
-
104
-
105
-
106
-
107
-
108
-
109
-
110
-
111
-
112
-
113
-
114
-
115
-
116
-
117
-
118
-
119
-
120
-
121
-
122
-
123
-
124
 |
 |

Table of Contents
SEAGATE TECHNOLOGY
NOTES TO CONSOLIDATED FINANCIAL STATEMENTS—(Continued)
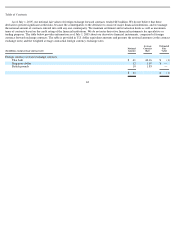
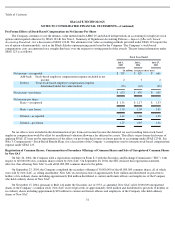
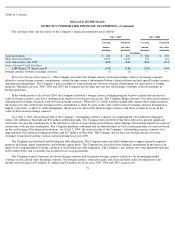
Net Income Per Share
In accordance with SFAS No. 128, “Earnings per Share,” the following table sets forth the computation of basic and diluted net income
per share:
Options to purchase 6.8 million, 3.7 million and 0.5 million shares of common stock were outstanding during fiscal years 2005, 2004 and
2003, respectively, but were not included in the computation of diluted net income per share because the options’ exercise price was greater
than the average market price of the common shares and, therefore, the effect would be anti-dilutive.
71
Fiscal Years Ended
July 1,
2005
July 2,
2004
June 27,
2003
(in millions, except per share data)
Numerator:
Net Income
$
707
$
529
$
641
Denominator:
Denominator for basic net income per share—weighted average number of
common shares outstanding during the period
468
452
418
Incremental common shares attributable to exercise of outstanding options
34
46
52
Denominator for diluted net income per share
502
498
470
Net income per share:
Basic
$
1.51
$
1.17
$
1.53
Diluted
$
1.41
$
1.06
$
1.36