Seagate 2004 Annual Report Download - page 34
Download and view the complete annual report
Please find page 34 of the 2004 Seagate annual report below. You can navigate through the pages in the report by either clicking on the pages listed below, or by using the keyword search tool below to find specific information within the annual report.-
 1
1 -
2
-
3
-
4
-
5
-
6
-
7
-
8
-
9
-
10
-
11
-
12
-
13
-
14
-
15
-
16
-
17
-
18
-
19
-
20
-
21
-
22
-
23
-
 24
24 -
 25
25 -
 26
26 -
 27
27 -
 28
28 -
 29
29 -
 30
30 -
 31
31 -
 32
32 -
 33
33 -
 34
34 -
 35
35 -
 36
36 -
 37
37 -
 38
38 -
 39
39 -
 40
40 -
 41
41 -
 42
42 -
 43
43 -
 44
44 -
45
-
46
-
47
-
48
-
49
-
50
-
51
-
52
-
53
-
54
-
55
-
56
-
57
-
58
-
59
-
60
-
61
-
62
-
63
-
64
-
65
-
66
-
67
-
68
-
69
-
70
-
71
-
72
-
73
-
74
-
75
-
76
-
77
-
78
-
79
-
80
-
81
-
82
-
83
-
84
-
85
-
86
-
87
-
88
-
89
-
90
-
91
-
92
-
93
-
94
-
95
-
96
-
97
-
98
-
99
-
100
-
101
-
102
-
103
-
104
-
105
-
106
-
107
-
108
-
109
-
110
-
111
-
112
-
113
-
114
-
115
-
116
-
117
-
118
-
119
-
120
-
121
-
122
-
123
-
124
 |
 |

Table of Contents
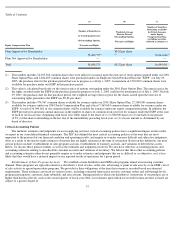
pursuant to the Indemnification Agreement between Seagate Delaware, Suez Acquisition Corporation and VERITAS. The tax indemnification
amount was recorded by us in connection with the purchase of the operating assets of Seagate Delaware and represented U.S. tax liabilities
previously accrued by Seagate Delaware for periods prior to the acquisition date of the operating assets. As a result of the conclusion of the tax
audits with no additional tax liabilities due, management determined that the $125 million accrual for the tax indemnification was no longer
required and it was reversed in our third quarter of fiscal year 2004.
Fiscal Year 2004 Compared to Fiscal Year 2003
Revenue. Revenue for fiscal year 2004 was $6.224 billion, down 4% from $6.486 billion in fiscal year 2003. The decrease in revenue
was primarily due to price erosion, particularly with respect to our enterprise storage products, partially offset by an increase in unit shipments.
Our unit shipments increased from 68 million units in fiscal year 2003 to 79 million units in fiscal year 2004. This increase in unit shipments
was primarily in our desktop storage products and was due to an increase in the total available market. Additionally, shipments increased as a
result of the introduction of our mobile computing storage product.
Our overall average unit sales price for our disc drive products was $81, $80, $76 and $71 for the first, second, third and fourth quarters
of fiscal year 2004, respectively. Price erosion from fiscal year 2003 to fiscal year 2004 was approximately 18%.
Unit shipments for desktop storage disc drives were 59.0 million for fiscal year 2004, up from 52.3 million in fiscal year 2003. However,
we did experience a slight decline in drive shipments for desktop applications in the fourth fiscal quarter which can be attributed to an
unexpected decline in industry distribution channel sell-through. Despite this decline, we believe that we maintained our market share.
Unit shipments for enterprise storage disc drives were 10.4 million during fiscal year 2004, slightly down from 10.5 million in fiscal year
2003; and, although we experienced aggressive pricing, we believe we maintained our market share.
During fiscal year 2004, we shipped 3.6 million mobile computing disc drives. We were impacted by our limited product set for this
market and our concentrated customer base. We also experienced aggressive pricing in the first half of calendar year 2004.
Unit shipments for consumer electronics storage disc drives were 6.3 million during fiscal year 2004, which represents a 33% increase in
shipments from fiscal year 2003. This reflects strong growth in shipments to digital video recorder consumer electronics applications.
We continued to maintain various sales programs aimed at increasing customer demand. We exercise judgment in formulating the
underlying estimates related to distributor inventory levels, sales program participation and customer claims submittals in determining the
provision for such programs. During fiscal year 2004, sales programs issued and recorded as contra-revenue, were approximately 7% of our
gross revenue, compared to 5% of our gross revenue for fiscal year 2003. The increase in the provision for sales programs as a percentage of
our gross revenue in fiscal year 2004 as compared to fiscal year 2003 was the result of higher distribution unit sales, particularly in the first half
of fiscal year 2004.
Cost of Revenue. Cost of revenue for fiscal year 2004 was $4.765 billion and was flat from $4.759 billion in fiscal year 2003. Gross
margin as a percentage of revenue for fiscal year 2004 was 23% as compared with 27% for fiscal year 2003. The decrease in gross margin as a
percentage of revenue was primarily due to price erosion as a result of fewer new product introductions and longer product cycles caused by a
slowing in the rate of increase in areal density. Gross margin as a percentage of revenue for the first, second, third and fourth quarters of fiscal
year 2004 was 27%, 26%, 22% and 17%, respectively.
Product Development Expense. Product development expense decreased by $4 million, or 1%, for fiscal year 2004 when compared
with fiscal year 2003. The decrease in product development expense from fiscal year
31